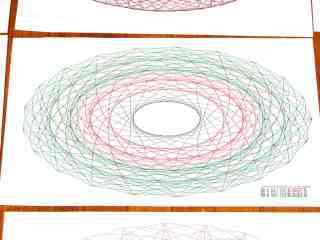
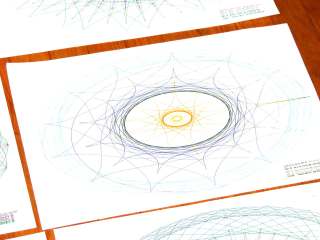
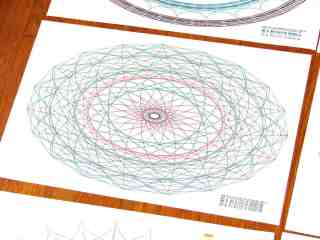
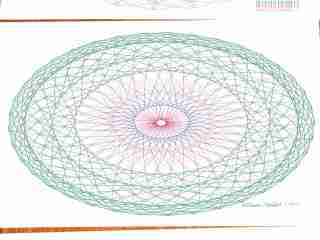
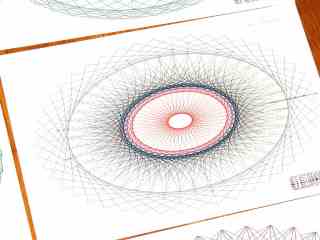
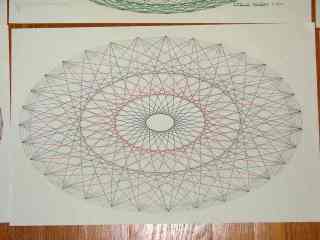
A gallery of SuperFormula plots, resized / contrast stretched / ruthlessly compressed (clicky for more dots):

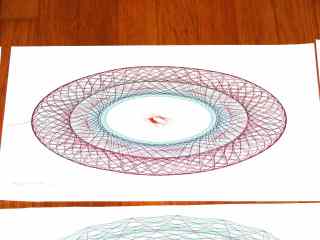


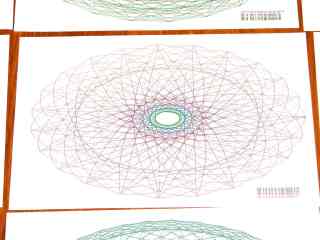


The gray one at the middle-bottom suffered from that specular reflection; the automagic contrast stretch couldn’t boost the paper with those burned pixels in the way.
Those sheets all have similar plots on the back, some plots used refilled pens that occasionally bled through the paper, others have obviously bad / dry pens, and you’ll spot abrupt color changes where I swapped out a defunct pen on the fly, but they should give you an idea of the variations.
The more recent plots have a legend in the right bottom corner with coefficients and timestamps:
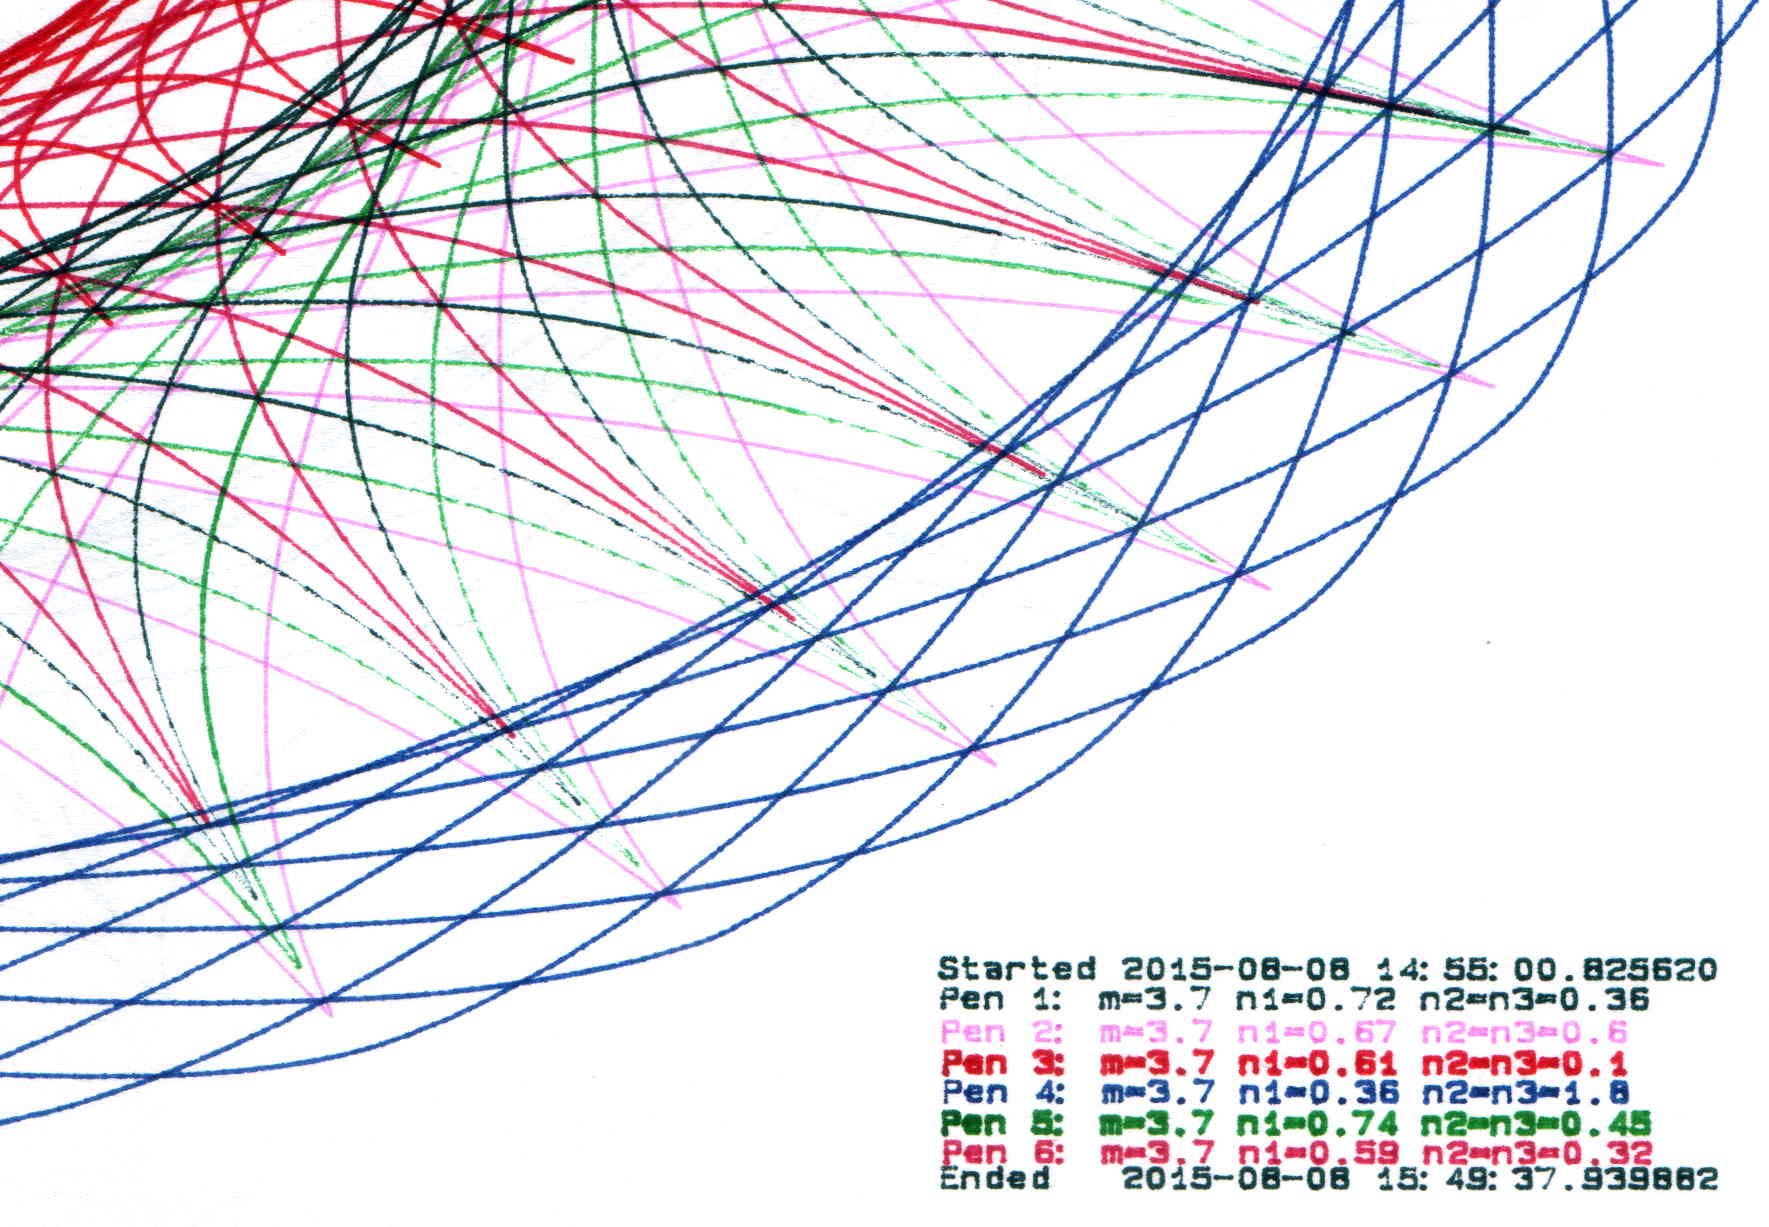
Limiting the pen speed to 10 cm/s (down from the default 38.1 cm/s = 15.00 inch/s) affects only the outermost segments of the spikes; down near the dense center, the 9600 b/s serial data rate limits the plotting speed. Plotting slowly helps old pens with low flow rates draw reasonably dense lines.
Each plot takes an hour, which should suffice for most dog-and-pony events.
I fill a trio of Python lists with useful coefficient values, then choose random elements for each plot: a single value of m determines the number of points for all six traces, then six pairs of values set n1 and n2=n3. The lists are heavily weighted to produce spiky traces, rather than smooth ovals, so the “random” list selections aren’t uniformly distributed across the full numeric range of the values.
Because the coefficient lists contain fixed values, the program can produce only a finite number of different plots, but I’m not expecting to see any duplicates. You can work out the possibilities by yourself.
The modified Chiplotle demo code bears little resemblance to the original:
from chiplotle import *
from math import *
from datetime import *
import random

def superformula_polar(a, b, m, n1, n2, n3, phi):
   ''' Computes the position of the point on a
   superformula curve.
   Superformula has first been proposed by Johan Gielis
   and is a generalization of superellipse.
   see: http://en.wikipedia.org/wiki/Superformula
   Tweaked to return polar coordinates
   '''

   t1 = cos(m * phi / 4.0) / a
   t1 = abs(t1)
   t1 = pow(t1, n2)

   t2 = sin(m * phi / 4.0) / b
   t2 = abs(t2)
   t2 = pow(t2, n3)

   t3 = -1 / float(n1)
   r = pow(t1 + t2, t3)
   if abs(r) == 0:
      return (0,0)
   else:
 #     return (r * cos(phi), r * sin(phi))
     return (r,phi)


def supershape(width, height, m, n1, n2, n3,
   point_count=10*1000, percentage=1.0, a=1.0, b=1.0, travel=None):
   '''Supershape, generated using the superformula first proposed
   by Johan Gielis.

   - `points_count` is the total number of points to compute.
   - `travel` is the length of the outline drawn in radians.
      3.1416 * 2 is a complete cycle.
   '''
   travel = travel or (10*2*pi)

   ## compute points...
   phis = [i * travel / point_count
      for i in range(1 + int(point_count * percentage))]
   points = [superformula_polar(a, b, m, n1, n2, n3, x) for x in phis]

   ## scale and transpose...
   path = [ ]
   for r, a in points:
      x = width * r * cos(a)
      y = height * r * sin(a)
      path.append(Coordinate(x, y))

   return Path(path)


## RUN DEMO CODE

if __name__ == '__main__':
   paperx = 8000
   papery = 5000
   tscale = 0.45
   numpens = 6
   m_list = [n/10.0 for n in [11, 13, 17, 19, 23, 29, 31, 37, 41, 43, 47, 53, 59]];   # prime/10 = number of spikes
   n1_list = [n/100.0 for n in range(15,75,1) + range(80,120,5) + range(120,200,10)]  # ring-ness 0.1 to 2.0, higher is larger diameter
   n2_list = [n/100.0 for n in range(10,50,1) + range(55,100,5) + range(110,200,10)]  # spike-ness 0.1 to 2.0, lower means spiky points
   paramlist = [[n1,n2] for n1 in random.sample(n1_list,numpens) for n2 in random.sample(n2_list,numpens)]
   if  not False:
     plt=instantiate_plotters()[0]
     plt.write('IN;')
#     plt.write(chr(27) + '.H200:')   # set hardware handshake block size
     plt.set_origin_center()
     plt.write(hpgl.SI(tscale*0.285,tscale*0.375))    # scale based on B size characters
     plt.write(hpgl.VS(10))                           # slow speed for those abrupt spikes
     pen = 1
     plt.select_pen(pen)
     plt.write(hpgl.PA([(paperx - 3000,-(papery - 600))]))
     plt.write(hpgl.LB("Started " + str(datetime.today())))
     m = random.choice(m_list)
     for n1, n2 in zip(random.sample(n1_list,numpens),random.sample(n2_list,numpens)):
        n3 = n2
        print "m: ", m, " n1: ", n1, " n2=n3: ", n2
        plt.write(hpgl.PA([(paperx - 3000,-(papery - 500 + 100*(pen - 1)))]))
        plt.select_pen(pen)
        plt.write(hpgl.LB("Pen " + str(pen) + ": m=" + str(m) + " n1=" + str(n1) + " n2=n3=" + str(n2)))
        e = supershape(paperx, papery, m, n1, n2, n3)
        plt.write(e)
        if pen < numpens:
            pen += 1
        else:
            pen = 1
     pen = 1
     plt.select_pen(pen)
     plt.write(hpgl.PA([(paperx - 3000,-(papery - 500 + 100*numpens))]))
     plt.write(hpgl.LB("Ended   " + str(datetime.today())))
     plt.select_pen(0)
   else:
     e = supershape(paperx, papery, 1.9, 0.8, 3, 3)
     io.view(e)
