Ed Nisley's Blog: Shop notes, electronics, firmware, machinery, 3D printing, laser cuttery, and curiosities. Contents: 100% human thinking, 0% AI slop.
Mary made a neck cozy based on a Craftsy description using a pattern I’d extracted from the low-res photo and rescaled to the proper size. The perimeter came out grittier than I like, but the laser had no trouble chopping it from a sheet of paper, and she cut smoothly around the lumps:
Neck Cozy mask – right
It looks better on her, but you get the general idea:
Neck Cozy – rev 1 finished
After some experience, however, she wanted to lengthen the top and bottom seams to improve the way it draped, which meant I had to modify the extracted pattern. The original pattern in the Craftsy photo was hand-drawn (which is perfectly fine) and the two halves were of two different sizes; we decided to work with the left half and produce a symmetric result.
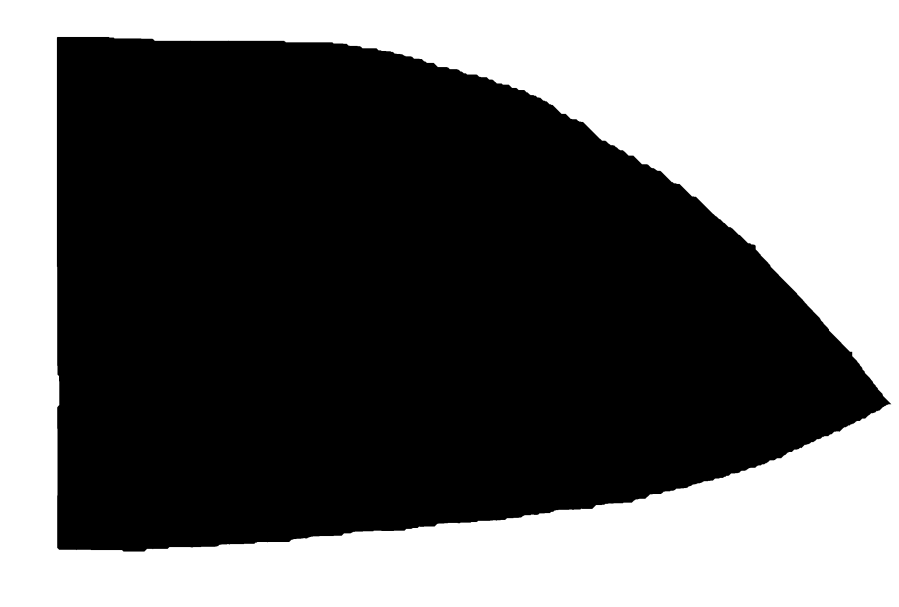
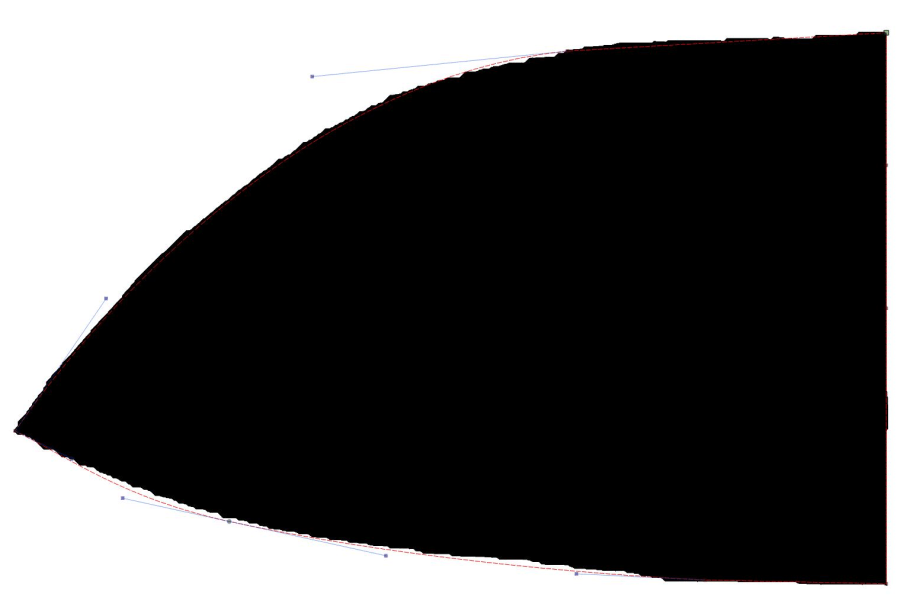
Rather than fiddle with the bitmap, I drew a rectangle around the outside of the left pattern mask, converted it to a path, moved the nodes to key locations, then fiddled with the control points to lay the splines along the perimeter:
Neck Cozy pattern – LB splines
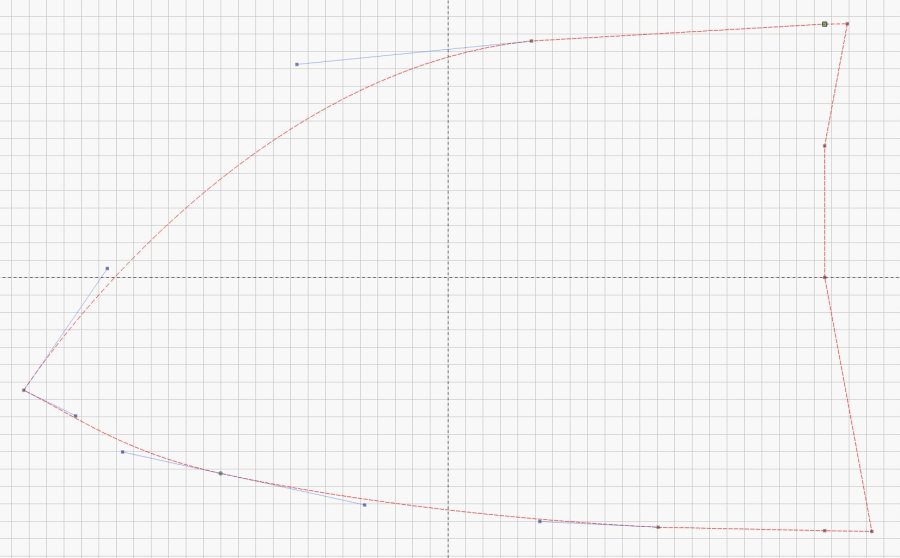
Removing the bitmap makes the splines much more obvious and shows the much smoother perimeter:
Neck Cozy pattern – LB extended splines
Adding a few nodes to change the splined shape is much simpler than fiddling with the bitmap, particularly when tweaking their position as directed by someone who knows how the fabric will eventually take shape.
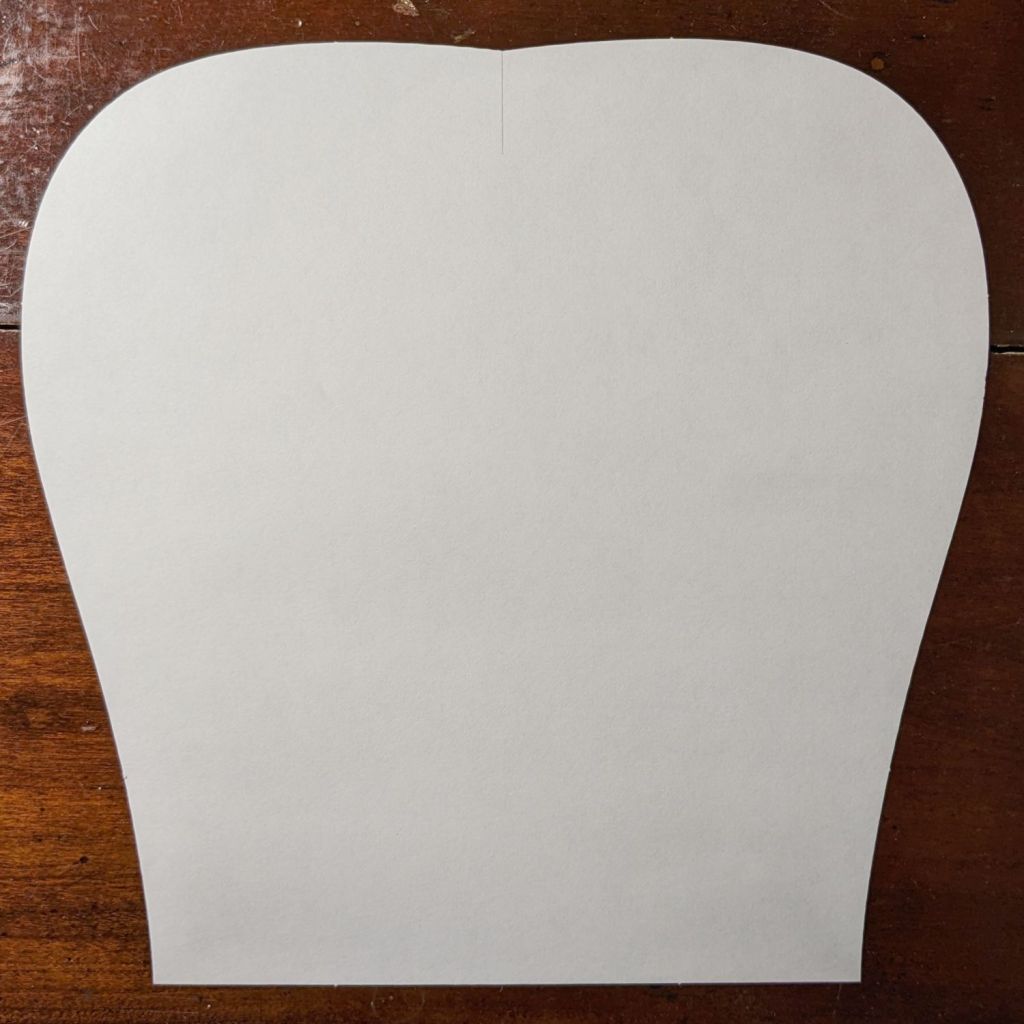
Add fiducial marks and a label, duplicate the shape, mirror it to get the other half, and fire the laser:
Neck Cozy pattern – as cut right
Fabric cutting isn’t in my wheelhouse, but I made the offer …
Mary is putting together a dogbone headrest pillow for a friend who will be spending a lot of time in a chair. It’ll be similar to this one from a while ago:
Dog Bone Pillow
She used Bonnie Browning’s pattern and I offered to laser-cut it as practice for other projects I have in mind.
It eventually worked out well enough:
Dog Bone Pillow – cut pattern
Fold a piece of fabric in half, align the pattern’s bottom edge with the fold, cut around the perimeter, make two more, and sew ’em together.
My first mistake was attempting to assemble the two halves of the pattern from the PDF document into a bitmap image using The GIMP:
D0G-BONE pattern – rejoined
That is both tedious and unnecessary, as I found out while trying to align the pieces.
The end goal is a simple and symmetric vector path defining the outline, including a line across the bottom, suitable for laser cutting. Rather than assembling an image, tracing it into a bunch of vectors, then cleaning up the mess, just lay a smooth spline vector path around half of it and invoke symmetry, much as happened with the Lip Balm Holder.
So import the slightly misaligned bitmap into LightBurn, draw a rectangle over just the left half, convert the rectangle to a path, then add a few nodes anchoring the splines to key points of the image:
Dog Bone Pillow – LB half pattern first splines
Although it’s not visible, the top and bottom spline nodes defining the vertical line down the middle are not quite vertically aligned, even though I dragged them to the middle of the pattern. Unsurprisingly, the bitmap image is not exactly aligned with the axes, even though the conversion from PDF to bitmap is entirely digital; the original design may be off by an itsy that would never matter for its intended application.
Tweak the splines / control points, add a few more nodes, and in short order the vector path runs pretty nearly along the middle of the bitmap image:
Dog Bone Pillow – LB half pattern overlay
Rather than trying to draw the second half just like the first half, duplicate the path and mirror the copy left-to-right to get the right half of the pattern. Grab the lower-left corner of the copy and snap it to the lower-right corner of the original, whereupon you will find the two points at the top of those lines don’t quite line up.
This is a grossly zoomed look at the top center, with the two red angles showing the two halves not quite meeting in the middle:
Click on the center point to define the Rotate center
Zoom way in on the top center
Click-n-drag the right corner to snap it onto the left corner
Done!
What just happened is that the right half now directly adjoins the left half, with the upper and lower center points overlapping.
Invoke the node editor and delete the center lines from both halves, leaving just the (overlaid) top and bottom nodes. Select both paths, then invoke Edit → Auto-join selected shapes to merge the two halves into one:
Dog Bone Pillow – LB splines
I missed the clip line in the middle of the top, but that’s why the first version is always a prototype.
This was easy, but it’s good to stay in practice …
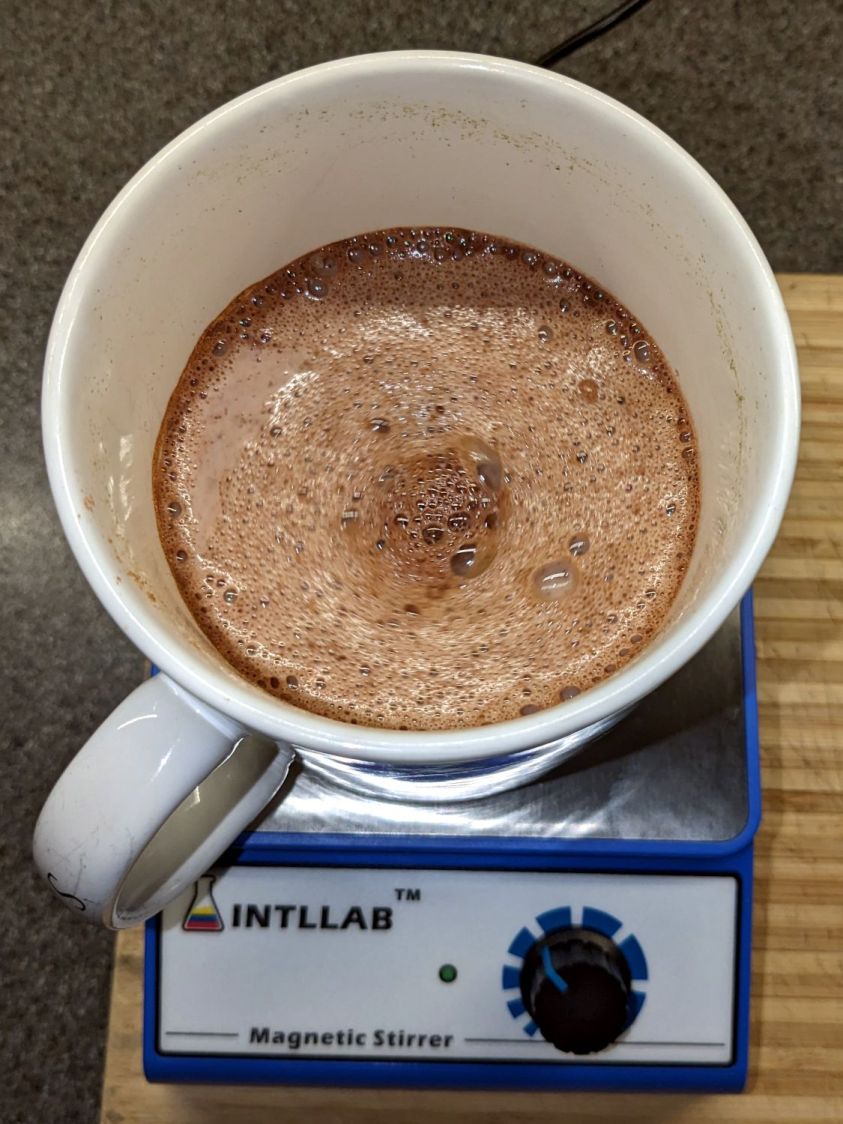
An addition to my morning cocoa makes it mmmm turn out better:
Cocoa magnetic stirring – magnet
Start with an ounce of milk, dump in the rest of the ingredients, spin up the stirrer, and slowly add the 8 oz of milk that just reached the end of its 70 seconds in the microwave:
Cocoa magnetic stirring – vortex
The green LED to the left of the speed knob runs from the PWM signal driving the motor, so it flickers visibly and interacts with the camera shutter.
Let it whir for a few minutes until all the cocoa bombs vanish and it’s ready for another 33 seconds in the microwave.
The most recent batch of cocoa arrived in an exceedingly vacuum-packed mylar bag, to the extent the bag resembled a brick and the solid cocoa within fractured into big chunks. Bashing the chunks with a fork got tedious enough to remind me of the stirrer I got to mix titanium dioxide for the yet-to-be-tried glass engraving.
Back in the day, the teflon shell molded on the magnet had a rib around its middle to make it pivot neatly on a point contact. This one is flat and dislikes spinning on the slightly concave cup bottom.
Protip: fish the stirrer out before sipping the cocoa, lest it become a tiny cow magnet.
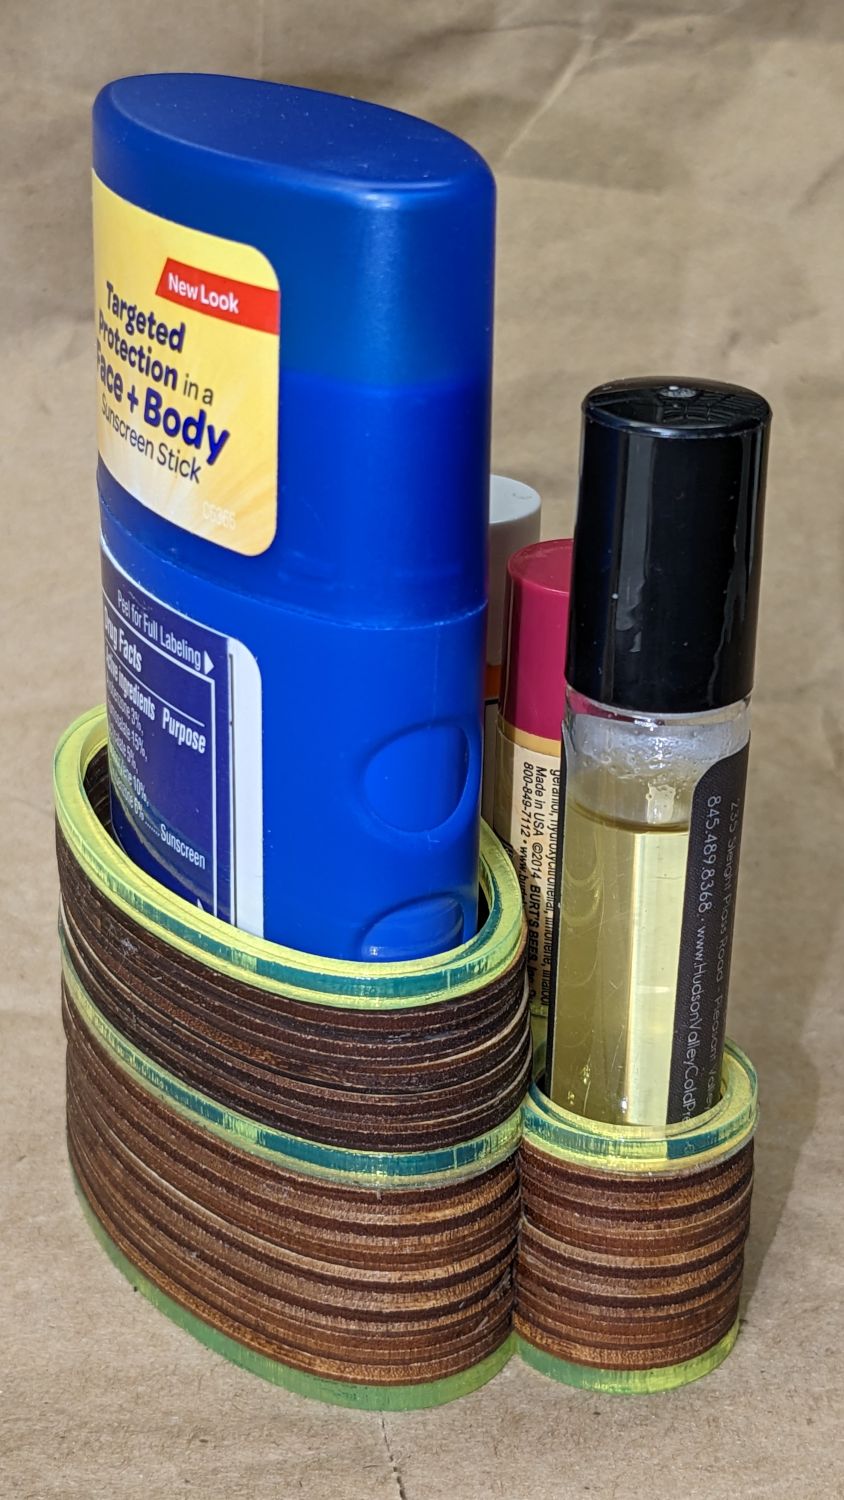
Loading the bike batteries into the Rolltop Cupcake Box reminded me I hadn’t updated the Lip Balm Holder around the latest tube of sunscreen. My excuse was I didn’t quite know how to model the not-quite-elliptical shape of the Coppertone sunscreeen tube in OpenSCAD, but now I can bypass that whole problem:
Lip Balm Holder – installed
The trick is to scan the bottom of the cap to get a high-contrast image:
Coppertone Sport Tube – lid scan
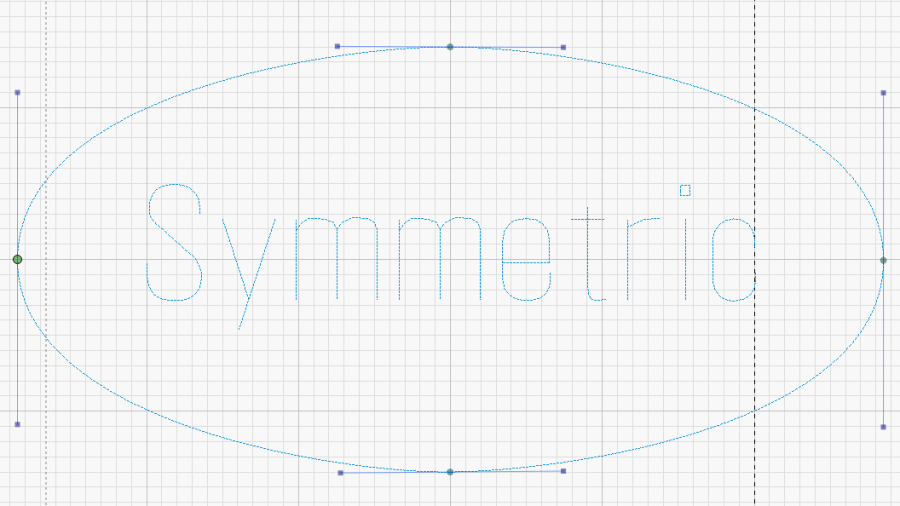
Import the image into LightBurn, draw a circle tangent to the outside of the cap’s smaller diameter, turn the circle into a path, drag the nodes and twiddle the control points to create a symmetric shape just outside the cap, then outset the result by 1.5 mm for clearance around the tube:
Coppertone Sport Tube – LB splines
That 3 mm of wiggle room lets us drop the tube into its socket without careful alignment.
The lip balm tubes all fit into 18 mm circles requiring no special design skillz:
Lip Balm Holder – LB layout
The mid-left oval goes around the Coppertone tube.
The top-mid drawing shows the 3 mm outset around each of the pieces, with the smaller tubes arranged to put their midlines tangent to each other and the oval tube. LightBurn does not, as far as I can tell, have a direct way to align a shape tangent to two other shapes at the same time, but iterating at increasingly absurd zoom levels gets the job done fairly quickly.
Welding those shapes together produces the top-right drawing, which serves as the template for the lower set of layers.
Deleting the inner details produces the mid-right blob for the bottom layer.
Most of the layers come from 3 mm plywood, with edge-lit acrylic on the top and bottom surfaces:
Lip Balm Holder – side view
Mary pronounced it better looking than the 3D printed version, which I agree clears a rather low bar, but it suffices for the job.
It’s now oriented with the back side of the lens toward the unfocused beam going into the laser head.
The front surface remains undamaged after two pulses at 500 ms 50% power:
Laser vs sunglasses – beam rear – front overview
The red disk in the middle of both wounds is new this time.
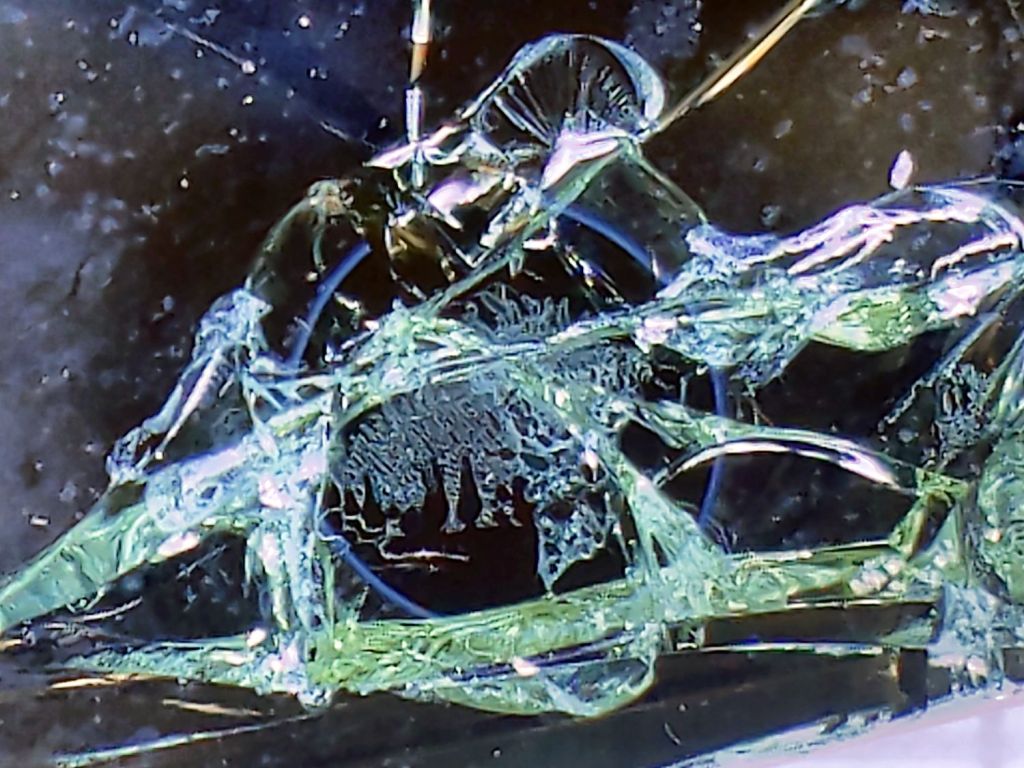
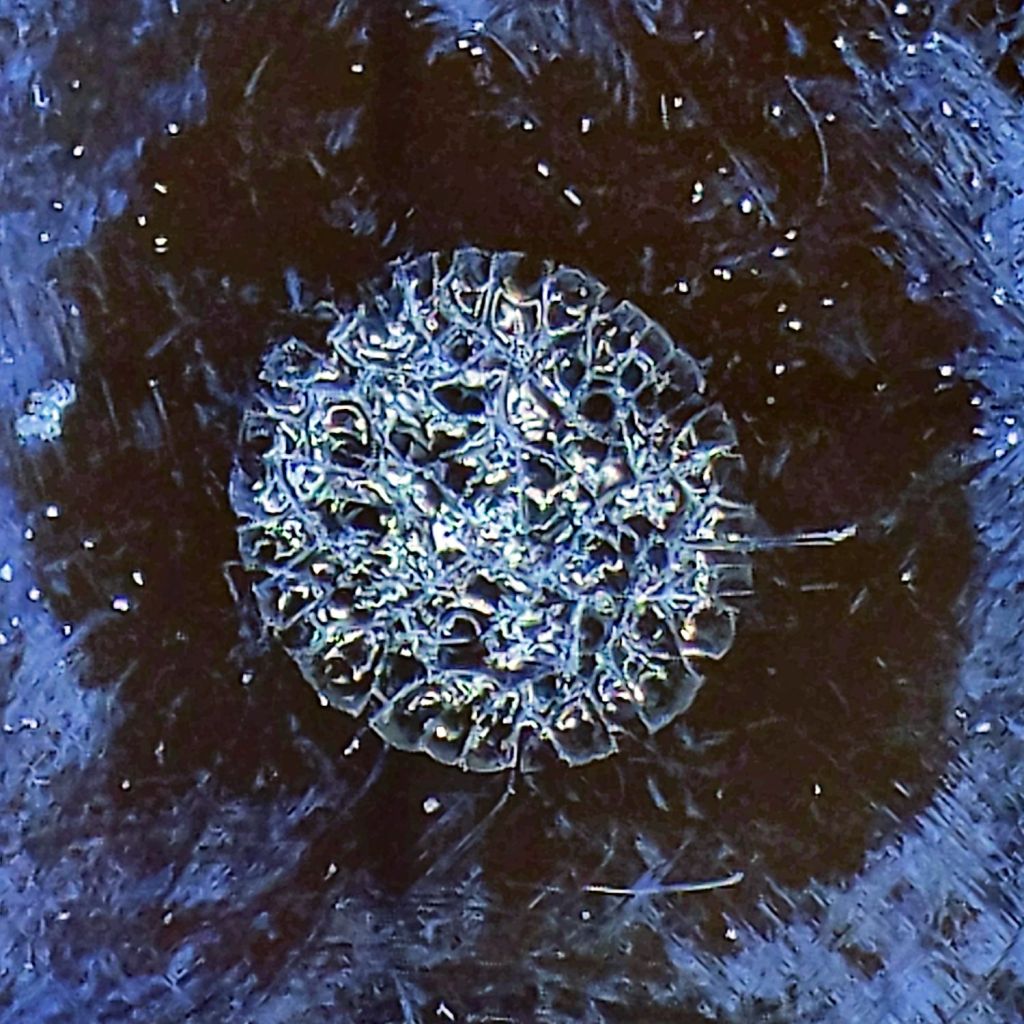
As seen from the rear, the first pulse shattered the rear glass layer:
Laser vs sunglasses – beam rear – A
The image is about 7 mm from side to side.
A chip of glass popped out of the upper part of the fracture, but the other pieces remained in place.
The distinct blue ring is 3 mm OD and marks the inner boundary of a purple disk surrounding the central burn. The disk appears only in reflected light (which is impossible to photograph with any setup I can manage), suggesting it comes from diffraction in a surprisingly uniform air layer blown between the glass and the plastic polarizing sheet.
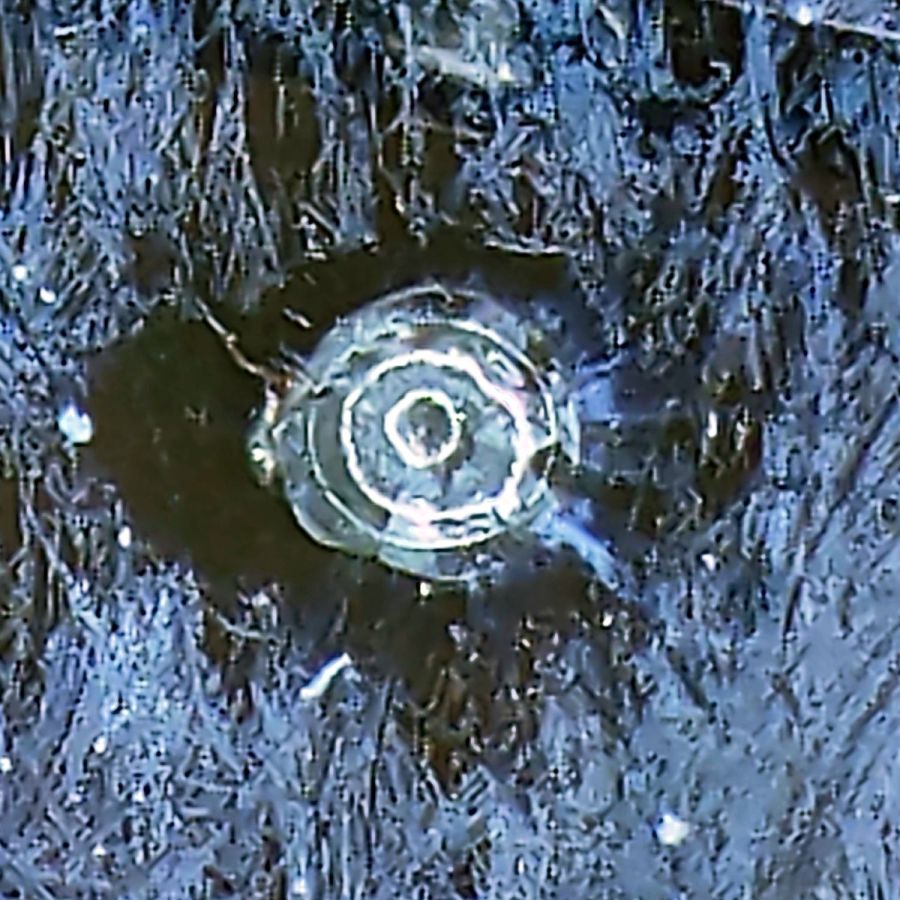
Also seen from the rear, the second pulse produced a neater wound:
Laser vs sunglasses – beam rear – B
The blue ring is again 3 mm OD and the image is 7 mm across.
The central red spot probably comes from damage to the polarizing sheet.
The most surprising things, at least to me, didn’t happen:
the glass lens didn’t disintegrate
the laser beam didn’t punch completely through
Protip: Don’t depend on ordinary glasses, even fancy sunglasses, to protect your eyes from CO₂ laser beams.
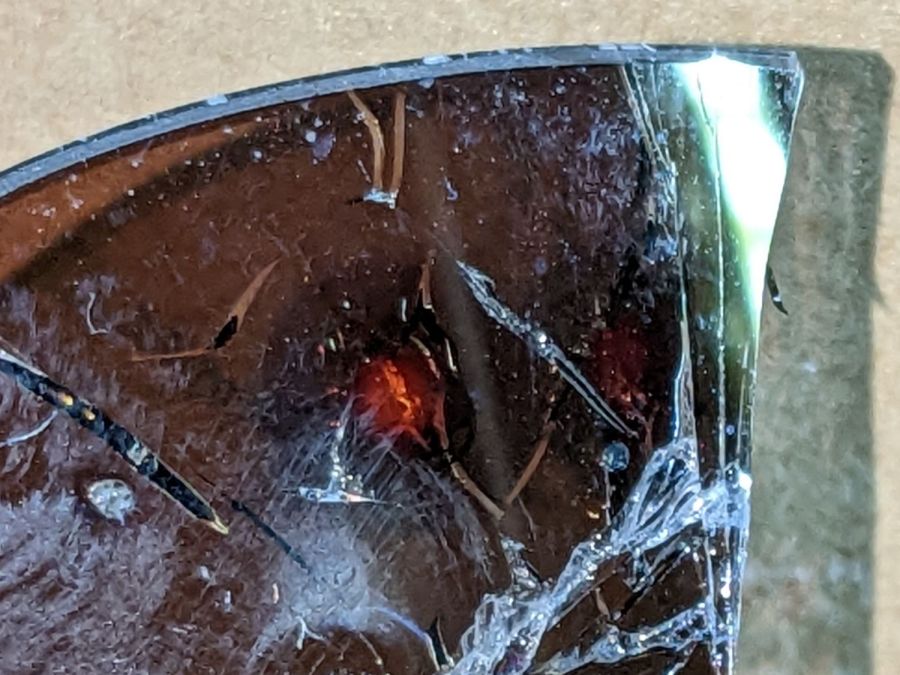
Well, a shattered lens found beside the road on a walk:
Laser vs sunglasses – focused overview
The battered frame has enough information to suggest they were once rather fancy. At this point, all that matters is they have two glass layers separated by a dark plastic polarizing film, with a gold-ish metallized front glass surface.
I fired the two pulses (on the left side of the obvious crack) at the front of the lens, both at 100 ms / 70% power:
Laser vs sunglasses – overview
Neither pulse penetrated the lens.
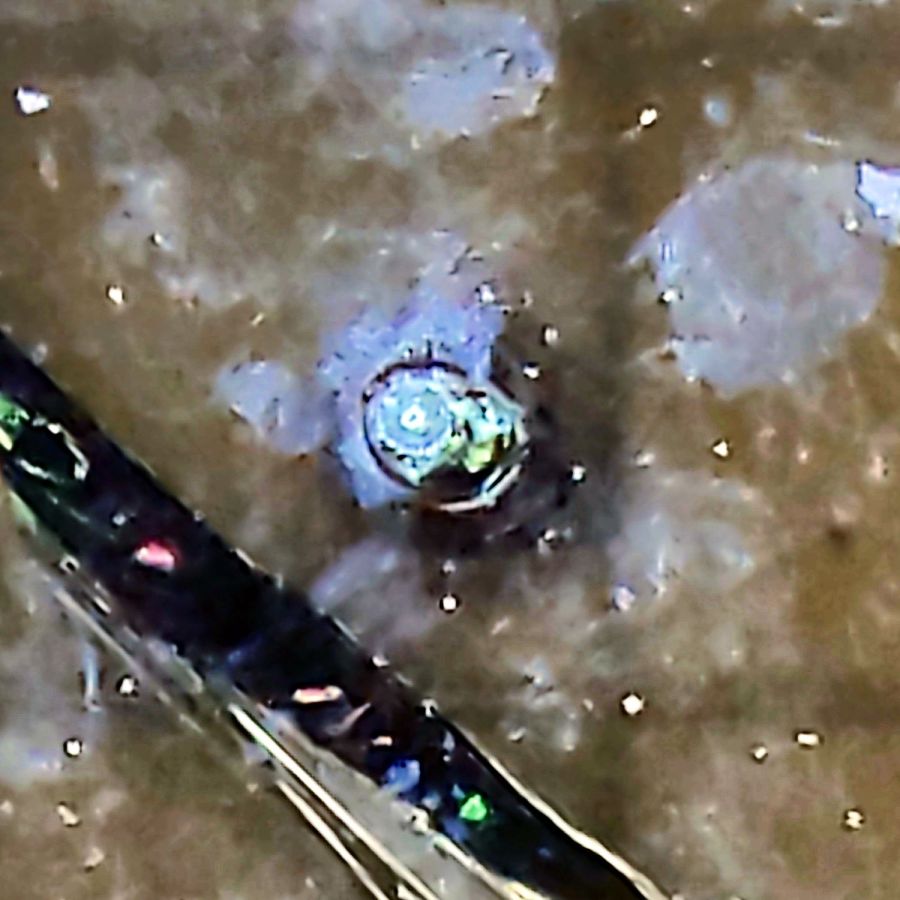
The smaller zit was fired in the position shown in the first picture, with the focal point more-or-less at the top surface of the lens. As seen from the front:
Laser vs sunglasses – focused front
The outer part of the damaged area is about 0.5 mm in diameter. The heat around the damage seems to have cleared away all the schmutz on the lens; those things that look like scratches are oily smears and road dirt.
Seen from the rear:
Laser vs sunglasses – focused rear
The rear surface is blistered, but doesn’t have a hole, so I think the beam melted the glass and inflated a cavity along its path.
I then perched the lens in the unfocused beam path, with paper taped over the laser head opening to keep any fragments off the mirror and focus lens:
Laser vs sunglasses – beam front overview
The beam produced the larger scar and also blasted off a ring of crud around the wound, as seen from the front surface:
Laser vs sunglasses – beam front
The beam seems to have shattered a thin layer under the metallization, but didn’t do any deeper damage. The rear surface is undamaged and the paper didn’t have a scorch mark.
They’re not laser safety glasses, but at least they didn’t disintegrate.
Protip: do not lie on the laser platform and stare upward into the laser head, even while wearing fancy polarized mirrorshades.


