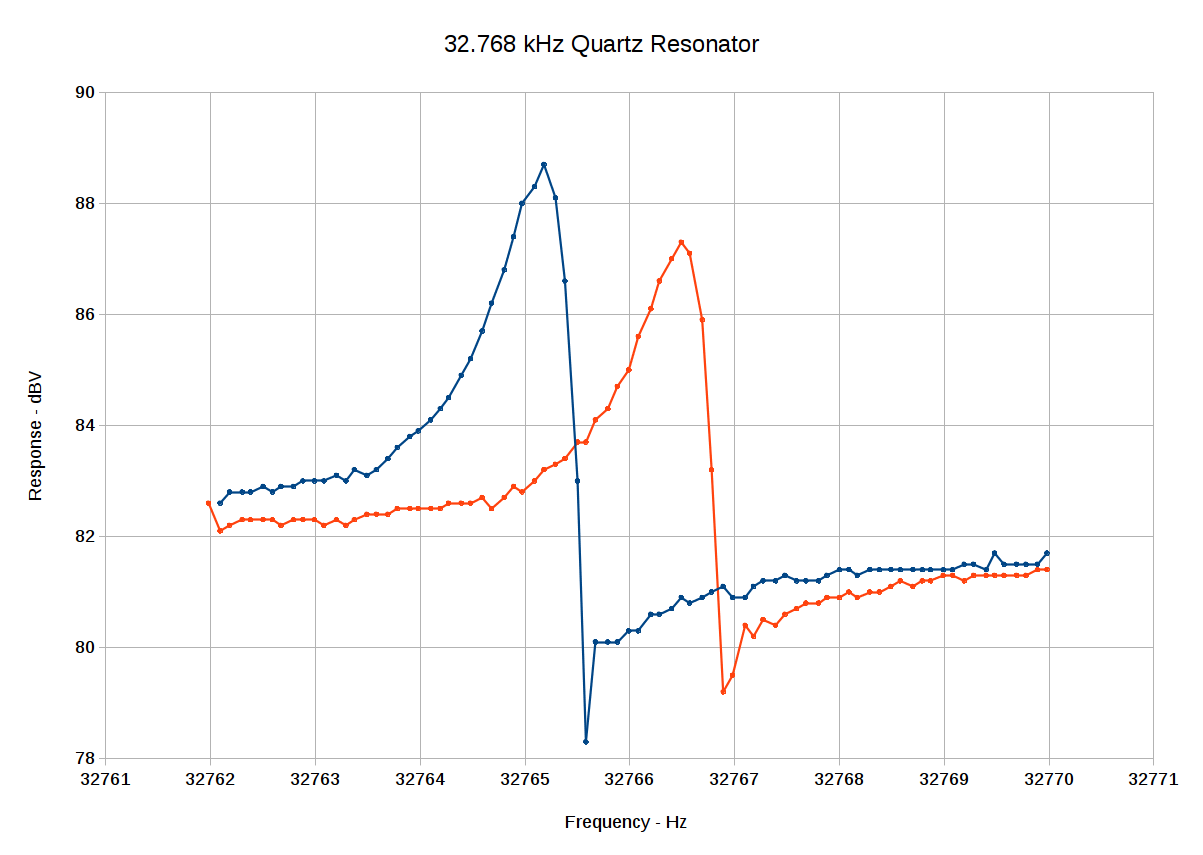
A slight modification spits out the (actual) frequency and dBV response (without subtracting the 108 dB intercept to avoid negative numbers for now) to the serial port in CSV format, wherein a quick copypasta into a LibreOffice Calc spreadsheet produces this:
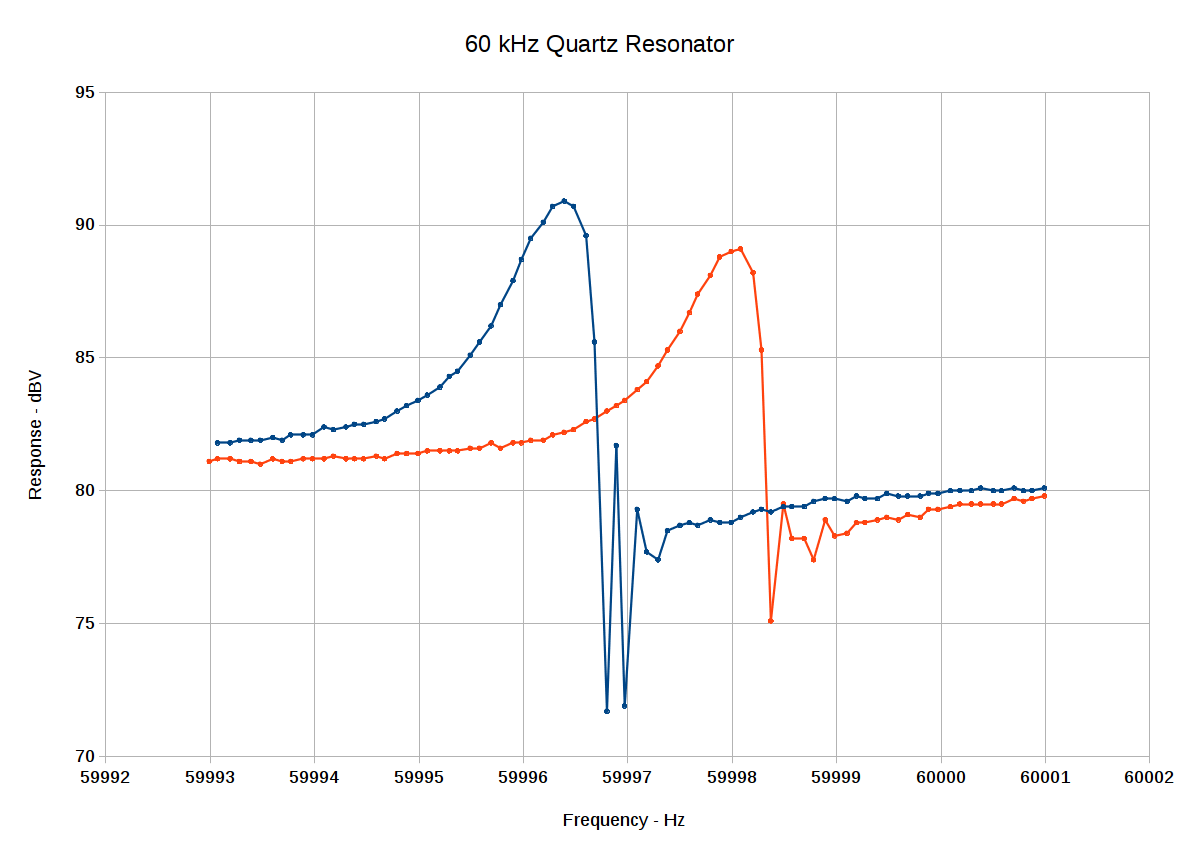
Changing the center frequency and swapping in a 60 kHz resonator:
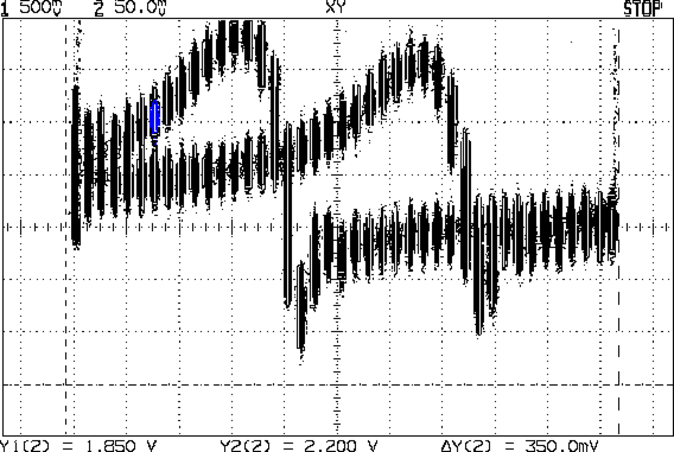
Much prettier than the raw scope shot with the same data, there can be no denyin’:
I think the wobbulations around the parallel resonant dip come from the excessively hugely too large 10 µF caps in the signal path, particularly right before the log amp input, although the video bandwidth hack on the AD8310 module may contribute to the problem. In any event, I can see the log amp output wobbling for about a second, which is way too long.
Anyhow, the series-resonant peaks look about 1 Hz wide at the -3 dBV points, more or less agreeing with what I found with the HP 8591 spectrum analyzer. The series cap is a bit smaller, producing a slightly larger frequency change in the series resonant frequency: a bit under 2 Hz, rather than the 1 Hz estimated with the function generator and spectrum analyzer.
I still don’t understand why the parallel resonant dip changes, although I haven’t actually done the pencil pushing required for true understanding.
Ain’t they lovely, though?

Comments
2 responses to “LF Crystal Tester: Pretty Plots”
I love it when a plan comes together! And yes, those are loverly.
[…] The last line squirts the temperature through the serial port to make those nice plots. […]