The Tektronix Circuit Computer, being a specialized circular slide rule, requires logarithmic scales bent around arcs:
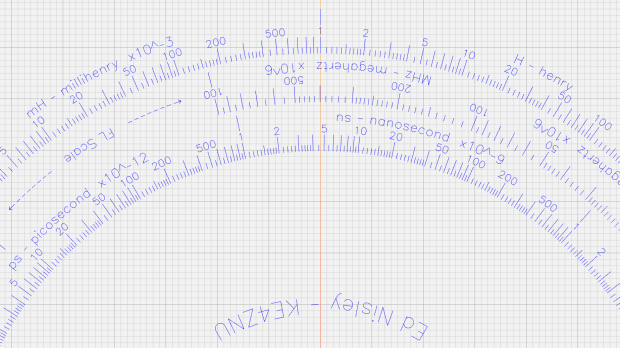
Each decade spans 18°, except for the FL scale’s 36° span to extract the square root of the LC product:
FL = 1 / (2π · sqrt(LC))The tick marks can point inward or outward from their baseline radius, with corresponding scale labels reading either inward or outward.
There being no (easy) way to algorithmically set the tick lengths, I used a (pair of) tables (a.k.a. vector lists):
TickScaleNarrow = {
  [1.0,TickMajor],
  [1.1,TickMinor],[1.2,TickMinor],[1.3,TickMinor],[1.4,TickMinor],
  [1.5,TickMid],
  [1.6,TickMinor],[1.7,TickMinor],[1.8,TickMinor],[1.9,TickMinor],
  [2.0,TickMajor],
  [2.2,TickMinor],[2.4,TickMinor],[2.6,TickMinor],[2.8,TickMinor],
  [3.0,TickMajor],
… and so on …
The first number in each vector is the tick value in the decade, the log of which corresponds to its angular position. The second gives its length, with three constants matching up to the actual lengths on the Tek scales.
The Circuit Computer labels only three ticks within each decade in the familiar (to EE bears, anyhow) 1, 2, 5 sequence. Their logs are 0.0, 0.3, and 0.7, spacing them neatly at the 1/3 decade points.
Pop quiz: If you wanted to label two evenly spaced ticks per decade, you’d mark 1 and …
Generating the L (inductance) scale on the bottom deck goes like this:
  Radius = DeckRad - ScaleSpace;

  MinLog = -9;
  MaxLog = 6;
  Arc = -ScaleArc;

  dec = 1;
  offset = 0deg;
  for (logval = MinLog; logval < MaxLog; logval++) {
    a = offset + logval * Arc;
    DrawTicks(Radius,TickScaleNarrow,OUTWARD,a,Arc,dec,INWARD,FALSE);
    dec = (dec == 100) ? 1 : 10 * dec;
  }

  a = offset + MaxLog * Arc;
  DrawTicks(Radius,TickScaleNarrow,OUTWARD,a,Arc,100,INWARD,TRUE);
The L scale covers 1 nH to 1 MH (!), as set by the MinLog and MaxLog values. Arc sets the angular size of each decade from ScaleArc, with the negative sign indicating the values increase in the clockwise direction.
The first decade starts with a tick labeled 1, so dec = 1. The next decade has dec = 10 and the third has dec = 100. Maybe I should have used the log values 0, 1, and 2, but that seemed too intricate.
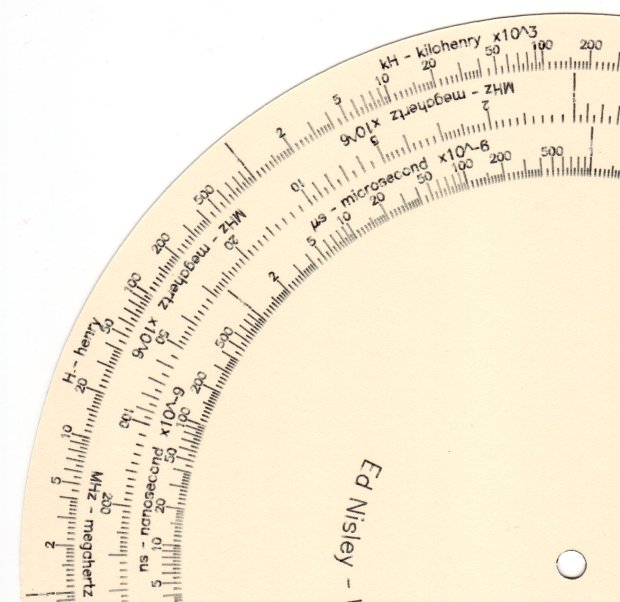
The angular offset is zero because this is the outermost scale, so 1.0 H will be at 0° (the picture is rotated about half a turns, so you’ll find it off to the left). All other scales on the deck have a nonzero offset to put their unit tick at the proper angle with respect to this one.
The scales have legends for each group of three decades, positioned in the middle of the group:
  logval = MinLog + 1.5;
  a = offset + logval * Arc;
  ArcLegend("nH - nanohenry  x10^-9",r,a,INWARD);

  logval += 3;
  a = offset + logval * Arc;
  ArcLegend("μH - microhenry  x10^-6",r,a,INWARD);
I wish there were a clean way to draw exponents, as the GCMC Hershey font does not include superscripts, but the characters already live at the small end of what’s do-able with a ballpoint pen cartridge. Engraving will surely work better, but stylin’ exponents are definitely in the nature of fine tuning.
With all that in hand, the scales look just like they should:
The GCMC source code as a GitHub Gist:
| //—- | |
| // Define tick layout for scales | |
| // Numeric value for scale, corresponding tick length | |
| TickScaleNarrow = { | |
| [1.0,TickMajor], | |
| [1.1,TickMinor],[1.2,TickMinor],[1.3,TickMinor],[1.4,TickMinor], | |
| [1.5,TickMid], | |
| [1.6,TickMinor],[1.7,TickMinor],[1.8,TickMinor],[1.9,TickMinor], | |
| [2.0,TickMajor], | |
| [2.2,TickMinor],[2.4,TickMinor],[2.6,TickMinor],[2.8,TickMinor], | |
| [3.0,TickMajor], | |
| [3.2,TickMinor],[3.4,TickMinor],[3.6,TickMinor],[3.8,TickMinor], | |
| [4.0,TickMajor], | |
| [4.5,TickMinor], | |
| [5.0,TickMajor], | |
| [5.5,TickMinor], | |
| [6.0,TickMajor], | |
| [6.5,TickMinor], | |
| [7.0,TickMajor], | |
| [7.5,TickMinor], | |
| [8.0,TickMajor], | |
| [8.5,TickMinor], | |
| [9.0,TickMajor], | |
| [9.5,TickMinor] | |
| }; | |
| TickScaleWide = { | |
| [1.0,TickMajor], | |
| [1.1,TickMinor],[1.2,TickMinor],[1.3,TickMinor],[1.4,TickMinor], | |
| [1.5,TickMid], | |
| [1.6,TickMinor],[1.7,TickMinor],[1.8,TickMinor],[1.9,TickMinor], | |
| [2.0,TickMajor], | |
| [2.1,TickMinor],[2.2,TickMinor],[2.3,TickMinor],[2.4,TickMinor], | |
| [2.5,TickMid], | |
| [2.6,TickMinor],[2.7,TickMinor],[2.8,TickMinor],[2.9,TickMinor], | |
| [3.0,TickMajor], | |
| [3.2,TickMinor],[3.4,TickMinor],[3.6,TickMinor],[3.8,TickMinor], | |
| [4.0,TickMajor], | |
| [4.2,TickMinor],[4.4,TickMinor],[4.6,TickMinor],[4.8,TickMinor], | |
| [5.0,TickMajor], | |
| [5.5,TickMinor], | |
| [6.0,TickMajor], | |
| [6.5,TickMinor], | |
| [7.0,TickMajor], | |
| [7.5,TickMinor], | |
| [8.0,TickMajor], | |
| [8.5,TickMinor], | |
| [9.0,TickMajor], | |
| [9.5,TickMinor] | |
| }; | |
| TickLabels = [1,2,5]; // labels only these ticks, must be integers | |
| /—– | |
| // Draw a decade of ticks & labels | |
| // ArcLength > 0 = CCW, < 0 = CW | |
| // UnitOnly forces just the unit tick, so as to allow creating the last tick of the scale | |
| function DrawTicks(Radius,TickMarks,TickOrient,UnitAngle,ArcLength,Decade,LabelOrient,UnitOnly) { | |
| feedrate(ScaleSpeed); | |
| local a,r0,r1,p0,p1; | |
| if (Decade == 1 || UnitOnly) { // draw unit marker | |
| a = UnitAngle; | |
| r0 = Radius + TickOrient * (TickMajor + 2*TickGap + ScaleTextSize.y); | |
| p0 = r0 * [cos(a),sin(a)]; | |
| r1 = Radius + TickOrient * (ScaleSpace – 2*TickGap); | |
| p1 = r1 * [cos(a),sin(a)]; | |
| goto(p0); | |
| move([-,-,EngraveZ]); | |
| move(p1); | |
| goto([-,-,TravelZ]); | |
| } | |
| local ticklist = UnitOnly ? {TickMarks[0]} : TickMarks; | |
| local tick; | |
| foreach(ticklist; tick) { | |
| a = UnitAngle + ArcLength * log10(tick[0]); | |
| p0 = Radius * [cos(a), sin(a)]; | |
| p1 = (Radius + TickOrient*tick[1]) * [cos(a), sin(a)]; | |
| goto(p0); | |
| move([-,-,EngraveZ]); | |
| move(p1); | |
| goto([-,-,TravelZ]); | |
| } | |
| feedrate(TextSpeed); // draw scale values | |
| local lrad = Radius + TickOrient * (TickMajor + TickGap); | |
| if (TickOrient == INWARD) { | |
| if (LabelOrient == INWARD) { | |
| lrad -= ScaleTextSize.y; // inward ticks + inward labels = offset inward | |
| } | |
| } | |
| else { | |
| if (LabelOrient == OUTWARD) { | |
| lrad += ScaleTextSize.y; // outward ticks + outward labels = offset outward | |
| } | |
| } | |
| ticklist = UnitOnly ? [TickLabels[0]] : TickLabels; | |
| local ltext,lpath,tpa; | |
| foreach(ticklist; tick) { | |
| ltext = to_string(Decade * to_int(tick)); | |
| lpath = scale(typeset(ltext,TextFont),ScaleTextSize); | |
| a = UnitAngle + ArcLength * log10(tick); | |
| tpa = ArcText(lpath,[0mm,0mm],lrad,a,TEXT_CENTERED,LabelOrient); | |
| engrave(tpa,TravelZ,EngraveZ); | |
| } | |
| } |

Comments
4 responses to “GCMC: Circular Slide Rule Scales”
I wonder if there is a way to translate this to the way a Curta does arithmetic. Something like unequally spaced teeth engaging a sprocket.
Ah, yes, the “math grenade”. It is to boggle one’s mind.
I have enough trouble with flat log scales, thank-you-very-much. [grin]
[…] logarithmic scales in hand, however, adapting the GCMC source code to produce general-purpose circular slide rules with only […]
[…] caption will read “Photo 1: A replica Tektronix Circuit Computer shown with its natural enemy, an HP 50g Graphing […]