The Smell of Molten Projects in the Morning

Ed Nisley's Blog: Shop notes, electronics, firmware, machinery, 3D printing, laser cuttery, and curiosities. Contents: 100% human thinking, 0% AI slop.

Tag: SDR

Software Defined Radios and circuitry

  • LF Crystal Tester: Grounded CX Case

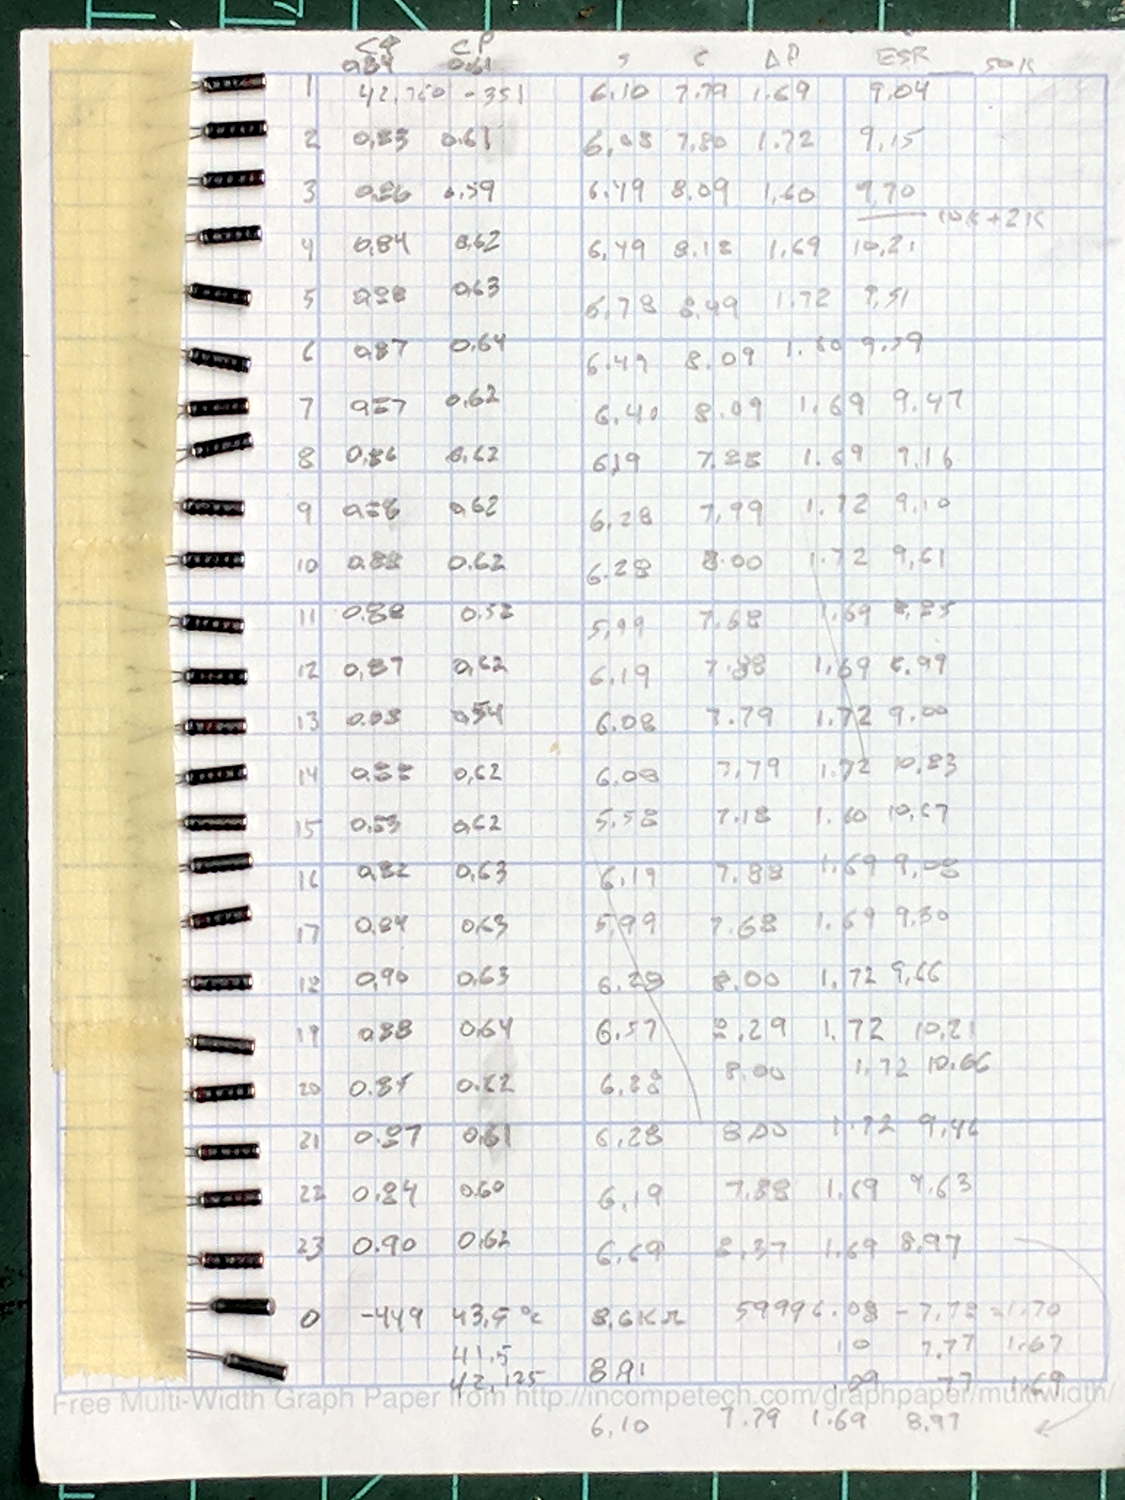
    The usual model for a quartz resonator apportions half the measured both-leads-to-case capacitance to each lead:

    AT26 crystal capacitance fixture - Cpar detail
    AT26 crystal capacitance fixture – Cpar detail

    These AT26 / TF26 cases run around 0.6 pF, so each parasitic capacitor is 300 fF:

    60 kHz Quartz Resonator - model
    60 kHz Quartz Resonator – model

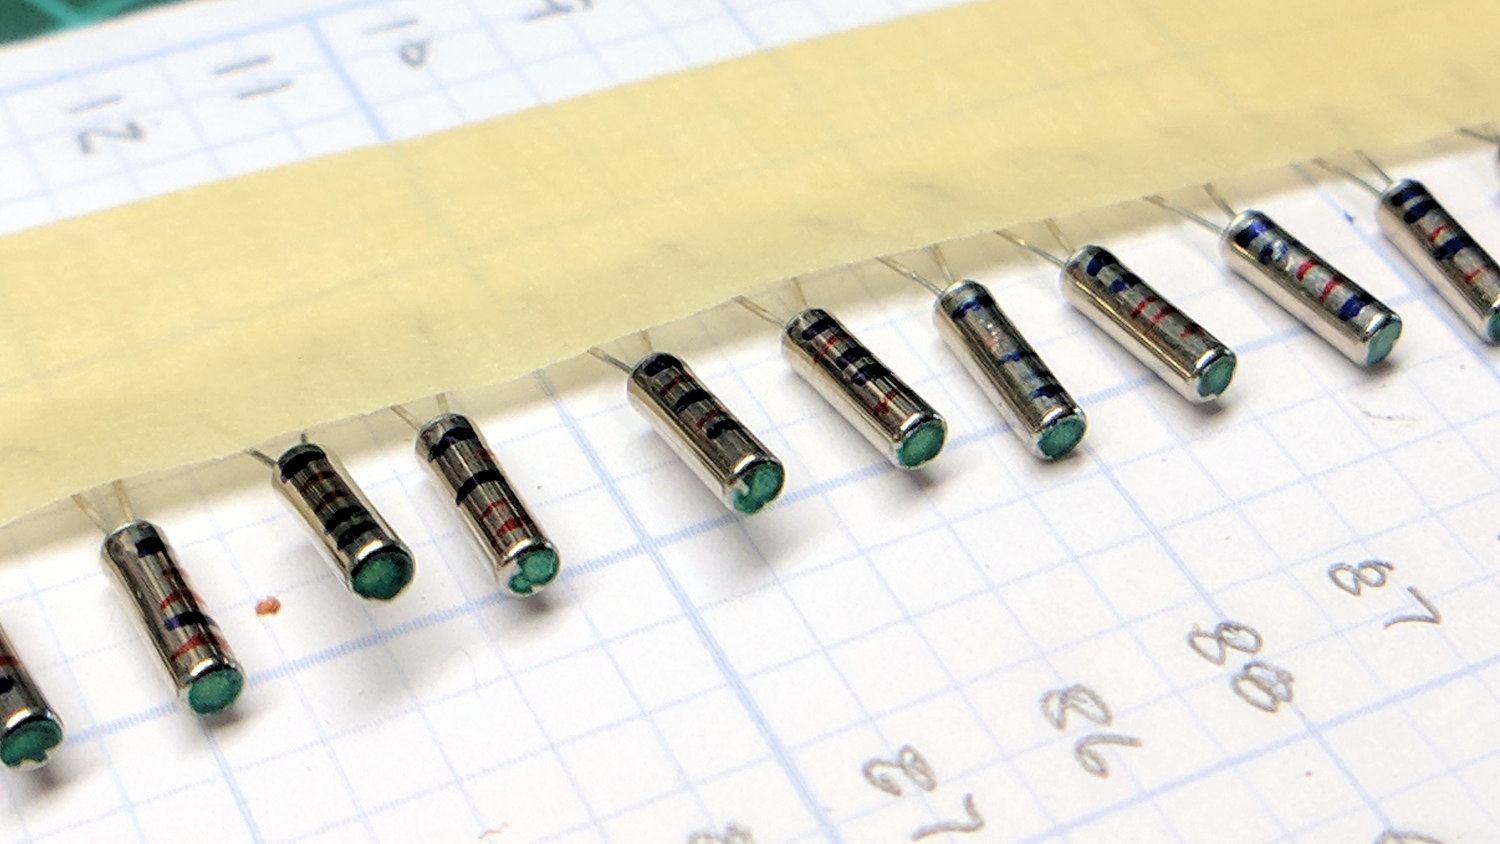
    For ordinary quartz crystals, you solder the case to the ground plane to get rid of the sneak path around the central capacitor (normally C0, but labeling it properly in LTSpice just isn’t happening), but those little aluminum cans aren’t solderable. One could blob some Wire Glue over them, but …

    So I just wrapped a wire around the case and soldered it to a convenient ground point under the board:

    LF Crystal Tester - grounded TF26 case
    LF Crystal Tester – grounded TF26 case

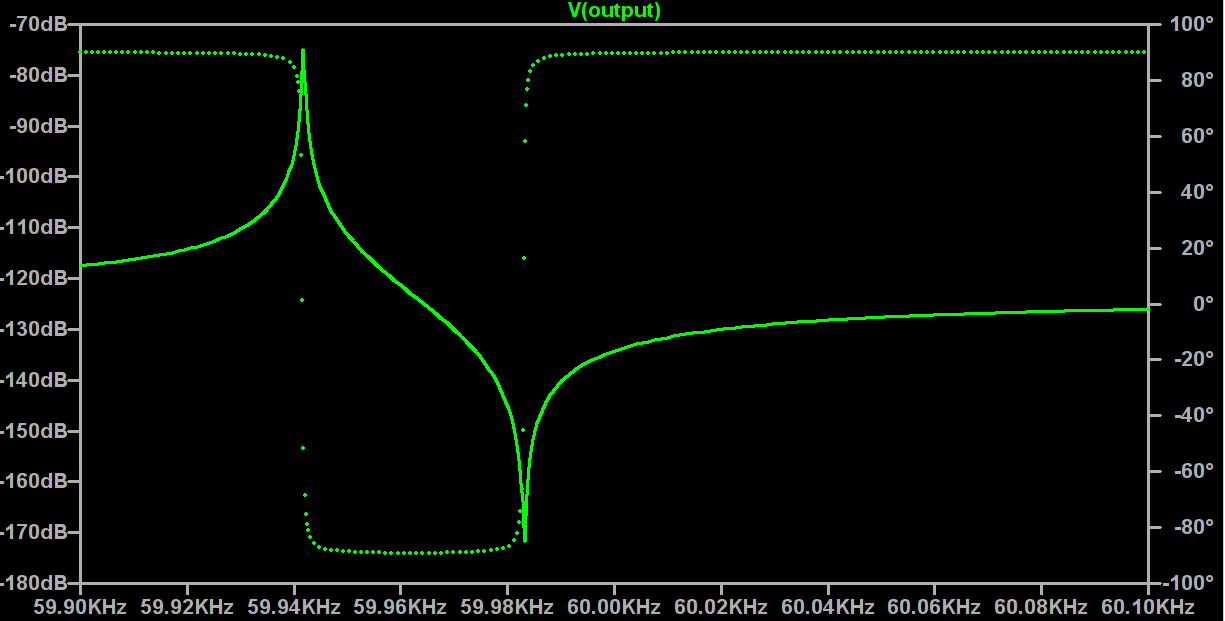
    Aaaand ran the obvious measurements:

    60 kHz Quartz Resonator 0 - CX 6 pF - grounded vs float
    60 kHz Quartz Resonator 0 – CX 6 pF – grounded vs float

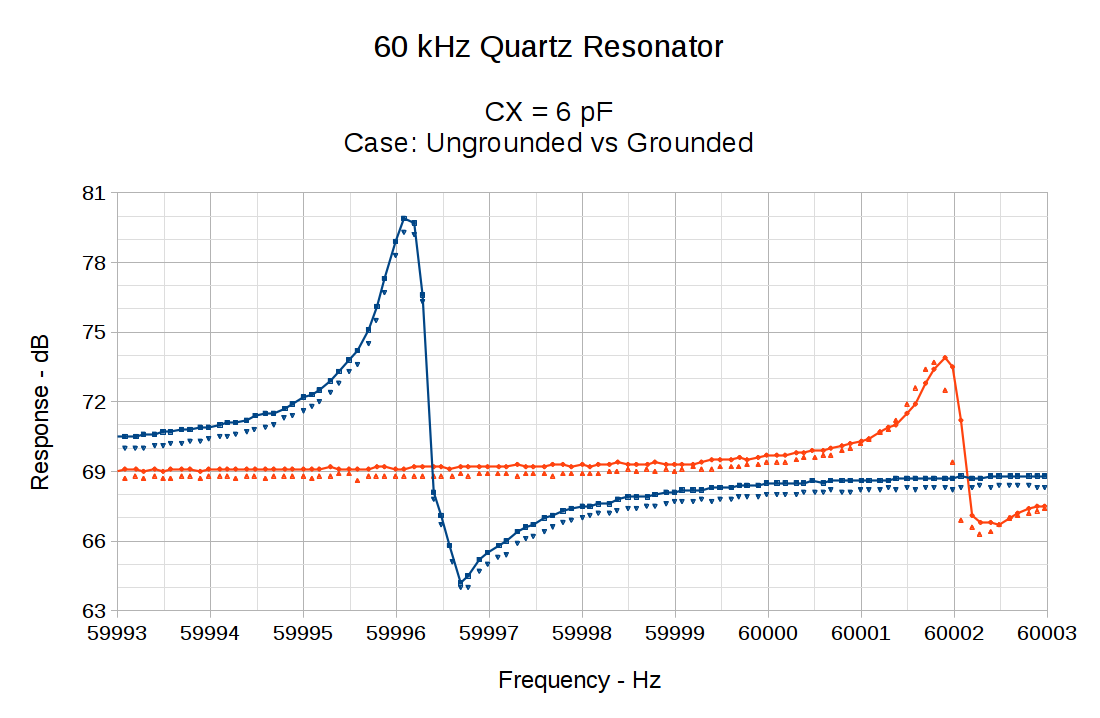
    Solid lines = case ungrounded. Dotties = case grounded.

    Grounding the case knocks the off-peak response down by less than 1 dB. The on-peak response remains about the same, so eliminating the series capacitance does reduce the blowthrough.

    With the case grounded and CX = 6 pF in the circuit, the peaks over on the right seem ever so slightly lower in frequency, which suggests a slightly higher motional capacitance. There’s not much to write home about, though, so I’d say there’s very little effect, even on this scale.


  • LF Crystal Tester: Resonance Frequencies vs CX

    Adjusting the series capacitor produces pretty much the expected results, with the parallel resonance still tracking the series peak.

    CX = 19.3 pF
    Fs peak: 59996.18 Hz 80.4 dbV
    Fc peak: 59998.19 Hz 78.2 dbV
    Delta frequency: 2.01

    60 kHz Quartz Resonator 0 - CX 19.3 pF
    60 kHz Quartz Resonator 0 – CX 19.3 pF

    CX = 9.9pF
    Fs peak: 59996.19 Hz 79.4 dbV
    Fc peak: 59999.97 Hz 75.8 dbV
    Delta frequency: 3.78

    60 kHz Quartz Resonator 0 - CX 9.9 pF
    60 kHz Quartz Resonator 0 – CX 9.9 pF

    CX = 6.8 pF
    Fs peak: 59996.10 Hz 80.3 dbV
    Fc peak: 60001.48 Hz 74.6 dbV
    Delta frequency: 5.38

    60 kHz Quartz Resonator 0 - CX 6.8 pF
    60 kHz Quartz Resonator 0 – CX 6.8 pF

    At the frequency resolution of these graphs, none of the standard equations are helpful; this is definitely a “tune for best picture” situation.

    So, assuming the same general conditions apply in a filter, a series capacitance around 10 pF should pull the resonant peak to 60.000 kHz. Unfortunately, the cheery 76 dB level is relative to the AD8310‘s nominal -108 dBV intercept at 4 μV: the log amp sees 25 mV after the MAX4255 op amp applies 40 dB (×100) of gain to the 250 μV coming from the resonator. The resonator drive is 1 μW = 150 mV, so the resonator produces a 55 dB loss for a signal dead on frequency.

    The off-peak attenuation looks like a mere 7 dB, although I hope plenty of noise masks the true result in this circuit.

    Phew & similar remarks.

  • LF Crystal Tester: Variable CX

    Replacing the 22 pF series capacitor with a variable cap went smoothly after I got over having to rip-and-replace the adjacent socket and header, too:

    LF Crystal Tester - variable CX
    LF Crystal Tester – variable CX

    The circuit remains the same, plus a test point to simplify measuring the actual capacitance:

    Test Fixture - variable CX
    Test Fixture – variable CX

    I didn’t add a jumper to disconnect the crystal fixture, because (I think) it would add too much uncontrolled stray capacitance: removing the header would disconnect the socket / header wires.

    The little red cap adjusts from (nominally) 3 pF to 28 pF over half a turn, without a stop. The rotor does have a marked side, but basically you’re supposed to tune for best picture and leave it at that.

    The AADE L/C meter works fine, but in the low pF range everything affects the reading. The only way to measure the actual capacitance seems to be:

    • Clip one lead to the top of the 24 Ω terminating resistor
    • Hold the other within a millimeter of the test point pin
    • Zero the meter, note any residual offset
    • Touch clip lead to test pin
    • Note reading, mentally subtract residual offset

    The as-installed range spans 6.5 pF to 28 pF. I think I can measure it to within ±0.05 pF, with a considerable dependence on maintaining the same pressure on the clip lead.

    I suppose if you were doing this for real, you’d throw another Teledyne relay at the problem.


  • 60 kHz Quartz Tuning Fork Resonator Data

    The first batch of 25 resonators:

    60 kHz TF26 resonators - Batch 1 data
    60 kHz TF26 resonators – Batch 1 data

    The second batch from the same eBay source arrived a few months later and I finally got around to measuring them:

    60 kHz TF26 resonators - Batch 2 data
    60 kHz TF26 resonators – Batch 2 data

    A dot of green Sharpie on the AT26 cans identifies the second batch:

    60 kHz TF26 resonators - Batch 2 marking
    60 kHz TF26 resonators – Batch 2 marking

    The alert reader will notice an un-measured 25th resonator at the bottom of the first batch. I dropped one from the second batch under the Electronics Workbench, found it, then also found its long-missing brother; now I have a genuine it’s-never-been-used resonator, just in case the need arises.

    A quick-and-dirty simulation shows the series and parallel resonant peaks come out close, but not dead on, the actual measurements:

    Simulation - 60 kHz resonator
    Simulation – 60 kHz resonator

    The model obviously doesn’t exactly match reality, which isn’t too surprising. However, I don’t understand something about tuning fork resonators, because the parallel resonance shouldn’t shift upward with the series resonant peak when the circuit gains a 24 pF series capacitance:

    Resonator 0 Spectrum
    Resonator 0 Spectrum

    Suffice it to say that doesn’t happen with the simulation.

    More study is needed, as the saying goes.

  • Quartz Resonator Test Fixture: Cleanup

    Isolating the USB port from the laptop eliminated a nasty ground loop, turning off the OLED while making measurements stifled a huge noise source, and averaging a few ADC readings produced this pleasing plot:

    Resonator 0 Spectrum
    Resonator 0 Spectrum

    Those nice smooth curves suggest the tester isn’t just measuring random junk.

    The OLED summarizes the results after the test sequence:

    LF Crystal Tester - OLED test summary - Resonator 0
    LF Crystal Tester – OLED test summary – Resonator 0

    Collecting all the numbers for that resonator in one place:

    • C0 = 1.0 pF
    • Rm = 9.0 kΩ
    • fs = 59996.10 Hz
    • fc = 59997.79 Hz
    • fc – fs = 1.69 Hz
    • Cx = 24 pF

    Turning the crank:

    CC 2017-11 - Resonator 0 Calculations
    CC 2017-11 – Resonator 0 Calculations

    I ripped that nice layout directly from my November Circuit Cellar column, because I’m absolutely not even going to try to recreate those equations here.

    Another two dozen resonators to go …


  • LF Crystal Tester: OLED Noise vs. Log Amp

    Having installed a cheap USB isolator to remove some obvious 60 Hz interference, the 100 Hz OLED refresh noise definitely stands out:

    Log amp - xtal amp - OLED noise
    Log amp – xtal amp – OLED noise

    The bottom trace comes from the 100× = 40 dB MAX4255 amplifier boosting the crystal output to a useful level. The fuzz on the waveform is actually the desired (off resonance) 60 kHz signal at maybe 30 mVpp, so the input is 300 µVpp.

    The worst part of the OLED noise looks like 100 mVpp, for about 1 mVpp at the crystal output, call it +10 dB over the desired signal. Some high-pass filtering would help, but it’s easier to just shut the display off while measuring the crystal.

    The top trace is the log amp output at (allegedly) 24 mV/dBV. The input bandwidth obviously extends way too low, as it’s neatly demodulating the input signal: the peaks correspond to both the positive and negative signal levels, so reducing the 1 µF input coupling caps will be in order.

    In between those 100 Hz groups, the input signal shines through to the log amp output at the V1 cursor. The peak noise rises 290 mV above that, so the log amp thinks it’s 12 dB higher. Pretty close to my guesstimated 10 dB, methinks.

    So, turning off the OLED should help a lot, which is feasible in this situation. If you must run the display while caring deeply about signal quality, you must devote considerably more attention to circuit construction quality.

  • AT26 / TF26 Quartz Resonator Identification

    There’s not much room on an AT26 / TF26 can for a readable label, unless one owns a metal-marking laser, but a simple bar code should let me identify each one:

    Quartz Resonators - binary marking
    Quartz Resonators – binary marking

    The empty “0” slot down at the bottom will hold the crash-test dummy resonator I’ve been using to get the tester working.

    The red-and-blue stripes from plain old fine-point Sharpie pens will rub off under duress, which I hope to avoid. After finishing up, I’m still not sure blue makes a better zero than red; you can make a convincing argument either way:

    Binary marked AT26 Quartz Resonators
    Binary marked AT26 Quartz Resonators

    The bag allegedly contained 25 resonators, although I’m willing to agree the last one escaped into the clutter on or under the Electronics Workbench.