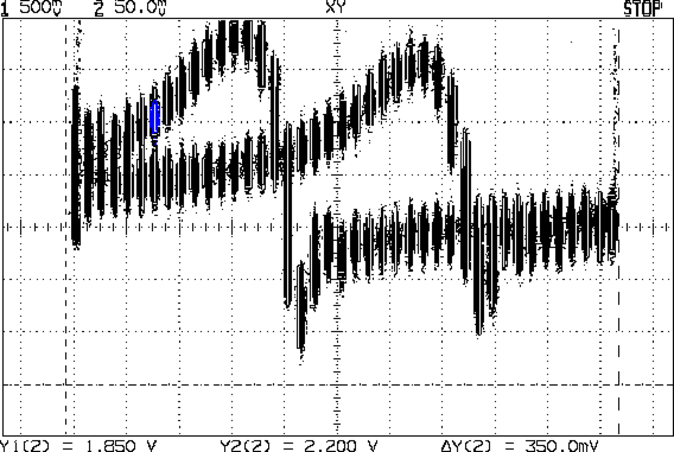
After adding a MAX4165 buffer amp to drive the crystal test fixture at 1 µW and a MAX4255 to amplify the 1 mV crystal output by 40 dB, then removing the AD8310 log amp module’s 50 Ω terminator to better match the MAX4255’s output drive ability, this happened:
That’s:
- A 32.768 kHz quartz resonator
- A ±2 Hz span centered on 32.766 kHz
- 0.10 Hz frequency steps
- The 22 pF cap out / in circuit (left & right peaks, respectively)
- Log amp output at 24 mV/dBV, with a nominal -108 dBV intercept at 0 V
With a 4 Hz span and 0.1 Hz steps, you get only 41 samples along the X axis: it’s supposed to look spotty.
The 2.2 V response at the top of the left peak corresponds to 2.2 / 24 mV/dBV = 91.7 dBV, then you knock off the -108 dBV intercept to get -16.3 dBV. The valley at 1.88 V is 78.3 – 108 = -29.7 dBV, down about 13 dBV from the corresponding peak. The peak-to-baseline over on the right looks like 200 mV = 8 dBV.
The AD8310 datasheet uses “intercept” in a manner I had not previously encountered. They plot the AD8310 output in volts against the input signal level in dBV, with the “intercept” marking the extrapolated point where the straight line with slope 24 mV/dBV crosses the X axis: the equation is volts = slope*(input dBV – intercept dBV). Back in the day, I learned the intercept was where the line crossed the Y axis at X=0, so the straight-line equation was simply y = slope*x + intercept. Took me a while to figure that out.
Then subtract the 40 dB gain from the crystal output to the log amp to get -56 dbV = 1.6 mV. That’s close enough to the 1 mV before adding the MAX4255. All those numbers seem slightly squishy, but they’re close enough.
The peaks are 13-ish spots apart, which corresponds to 1.3 Hz, which is roughly the 1 Hz I measured with the HP8591 spectrum analyzer. The baseline is down 8 dBV, not quite as much as the analyzer’s 13 dB at 1 Hz offset from the peaks.
What’s not right: the parallel-resonant dip to the right of each peak should be at the same frequency for both traces, because it doesn’t vary with added series capacitance, but it’s pretty much tracking the series-resonant peak frequency.
The amount of noise on the log amp output looks like 50 mV = 2 dBV. That’s a lot, compared to the 13 dBV response, but some judicious averaging may save the day.
The 22 MHz GBW of the MAX4255 rolls off the high end at 220 kHz. I AC coupled the signal chain with 10 µF dipped tantalum caps from my lifetime supply, which may pass entirely too much of the low end; the settling time is way too long. This probably requires smaller caps and maybe an actual bandpass filter.
The 50 mV-ish noise on the DAC output driving the X axis suggests my proto board layout isn’t up to the demands of this circuit: there shouldn’t be any noise in that direction.
Some poking around suggests the OLED display is way noisier than you’d (well, I’d) expect. The faded-out lower section in the picture below suggests it’s refreshing one line = 128 pixels at a time. More study is indicated.
But, if you squint hard enough, this lashup produces numbers in the right ballpark. Given that it’s a collection of cheap-as-dirt eBay modules flying in formation, that’s nothing to sniff at:

Those “gold tone” SMA connectors really make it look like serious RF hardware, don’t they? [grin]
The round twiddlepot floating on the white pillow trims the DDS output voltage by a factor of two = 6 dB. Combined with the 0-6-12-18 dB gain steps provided by the header in front of the MAX4165 (to the right of the pillow), you can set the drive voltage so the crystal gets (roughly) its rated 1 µW maximum drive power.

Comments
7 responses to “LF Crystal Tester: First Light!”
I’m amused at a microwatt amplifier, but I understand why buffering is useful here. When i first read “The peaks are 13-ish spots apart, which corresponds to 1.3 H”, I was wondering “1.3 Henry?” That seems like a lot of inductance for a crystal. Then I realized the intended text was likely “1.3Hz”, which makes a lot more sense. As ever, I enjoy these projects that build up useful data from first principles.
Fixed! Thanks.
Turns out those critters have a motional inductance around 10 kH (yup, kilohenry), which I flat-out didn’t believe until I worked through the measurements & equations a few times: a quartz tuning fork combines an absurdly large ESR with a giant inductance to produce a mighty Q.
And, yeah, starting from scratch has the benefit of showing how the thing actually works or, sometimes, why it doesn’t, which can be even more interesting …
[…] hidden under that neat top surface. I think that’s why the whole setup shows only about 8 dB of dynamic range; more attention to detail may be in order, although the peaks probably won’t move all that […]
[…] have big fixed point numbers lying around and, with the I²C hardware up & running from the X axis DAC and OLED display, this was […]
[…] The OLED display refresh contributes 100 Hz noise pulses to the low-level sine wave from the crystal test fixture: […]
[…] The second batch from the same eBay source arrived a few months later and I finally got around to measuring them: […]
[…] the crystal tester program and grafting a simple joystick interface onto the corpse produces an LF sine wave generator with […]