Ed Nisley's Blog: Shop notes, electronics, firmware, machinery, 3D printing, laser cuttery, and curiosities. Contents: 100% human thinking, 0% AI slop.
Category: Science
If you measure something often enough, it becomes science
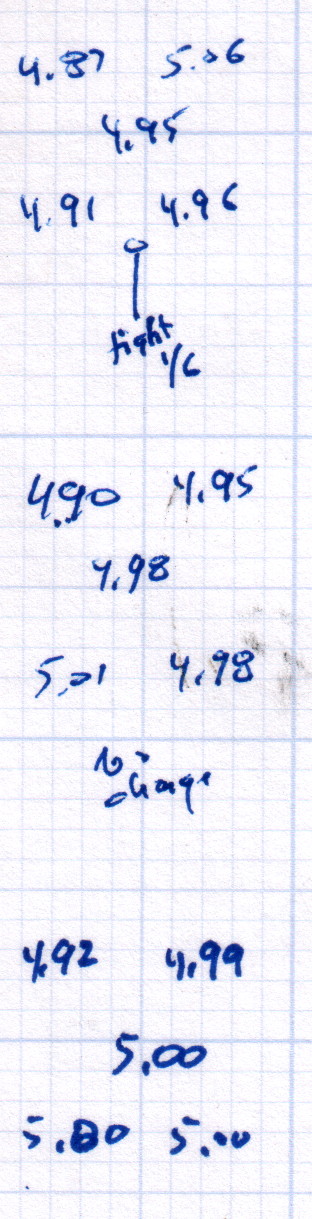
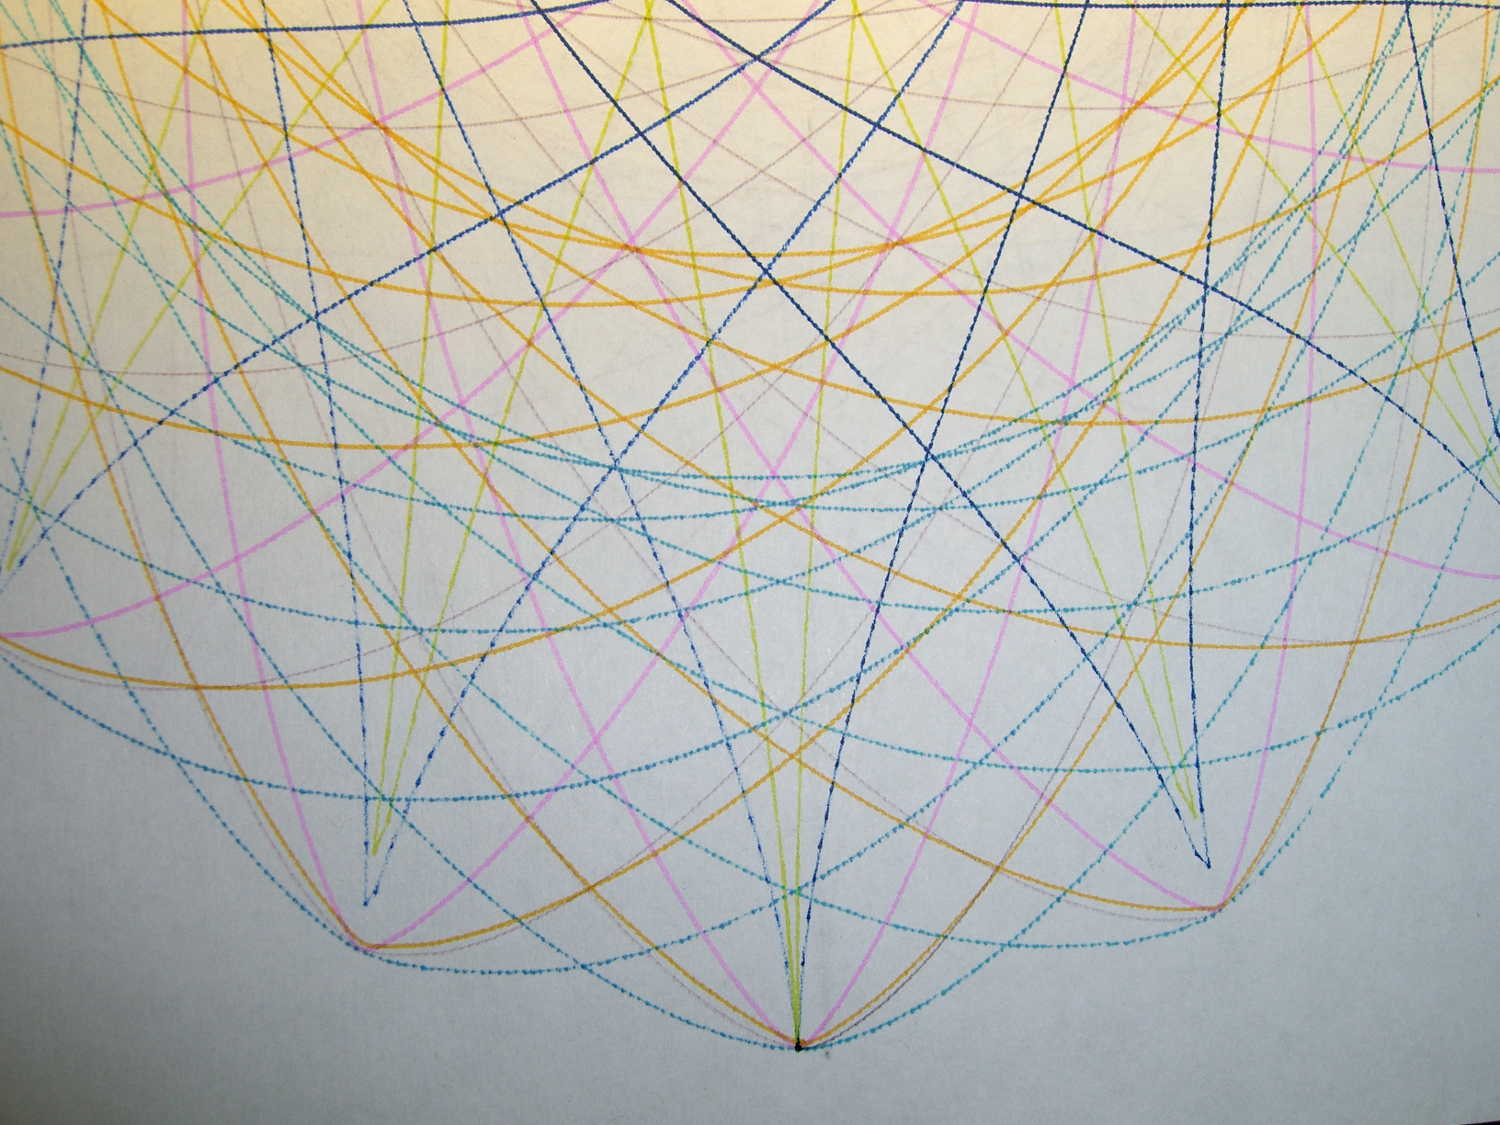
After replacing that washer, the last step in the platform alignment required 1/6 turn on the front screw between the top two sets of measurements:
M2 Alignment measurements – 2015-08-09 – 2
The last two sets show the sample-to-sample variation with no adjustments, which didn’t amount to much.
Without changing anything else, I then switched from magenta PETG filament to cyan and ran off two more sets of thinwall hollow boxes (in addition to other doodads) over the next two days:
M2 Alignment measurements – 2015-08-10
A bit less than a month later, after producing several iterations of unrelateddoodads:
M2 Alignment measurements – 2015-09-07
The variation in the center box height from 4.94 mm to 5.00 mm shows that sensing the platform Z-axis position directly on the glass surface actually works the way it should: ±0.03 mm is as good as it gets. Given that my measurement error / eyeballometric averaging on any given box runs around ±0.02 mm, the far corners also seem rock-stable and certainly don’t justify automatic alignment probing and adjustment.
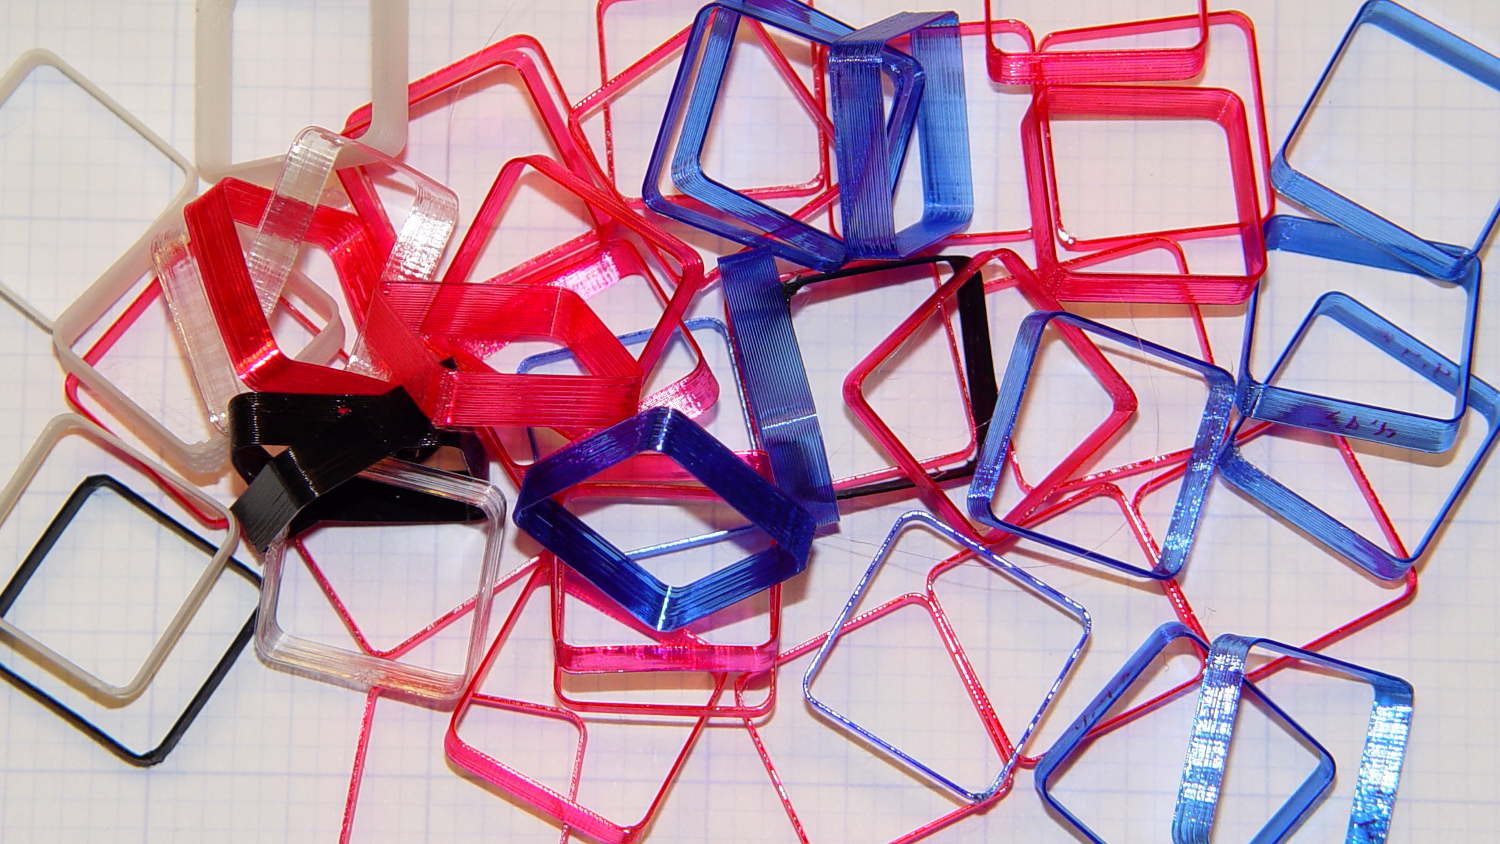
Thinwall hollow boxes make good handouts at 3D printing presentations…
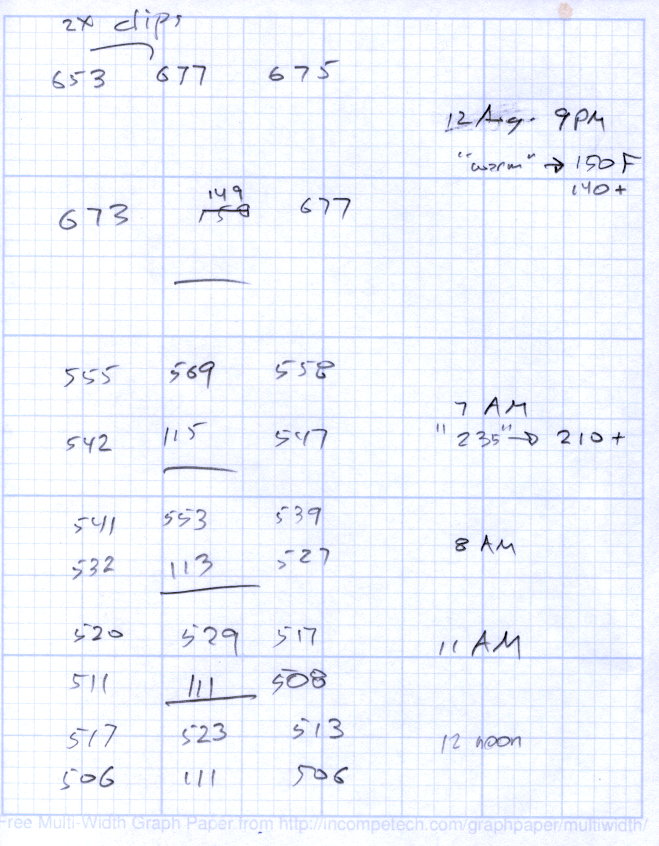
Last month’s basement safe log showed the humidity (blue trace) relentlessly rising:
Basement Safe – 2015-08-09
Replacing that bag emptied the dried silica gel stash, so I piled six saturated bags in the oven for an overnight regeneration with the oven set to “Warm”, which the IR thermometer reported as 140 °F or so at the bag surface. They sat on cooling racks atop cookie sheets that pretty much filled two oven shelves, with good air flow across their tops and minimal flow between bags and cookie sheet.
The last time around, I spread the beads directly on the cookie sheets. That seemed like a lot of effort, so I wanted to see how the low-labor alternative worked.
The two upper-left bags in each group had a pair of bulldog clips holding them closed. The larger bags hold 500 g of “dry” silica gel and the center bag in the lower row was a smaller mesh bag:
Silica Gel drying – 2015-08-12
The big bags lost a bit under 130 g during 10 hours, call it 12 g/h, and felt slightly damp on their lower surface.
I cranked the oven to 230 °F, the lowest actual heat setting, for 210 °F on the bag surface. That got rid of the last 30 g in three hours; another hour brought them to pretty nearly their dry weight of 507 g (gross, with bag / staples / clips).
Drying being an exponential process, it looks like an overnight bake at “230 °F” will do the trick without melting the bags; the lower temperature doesn’t quite get the job done.
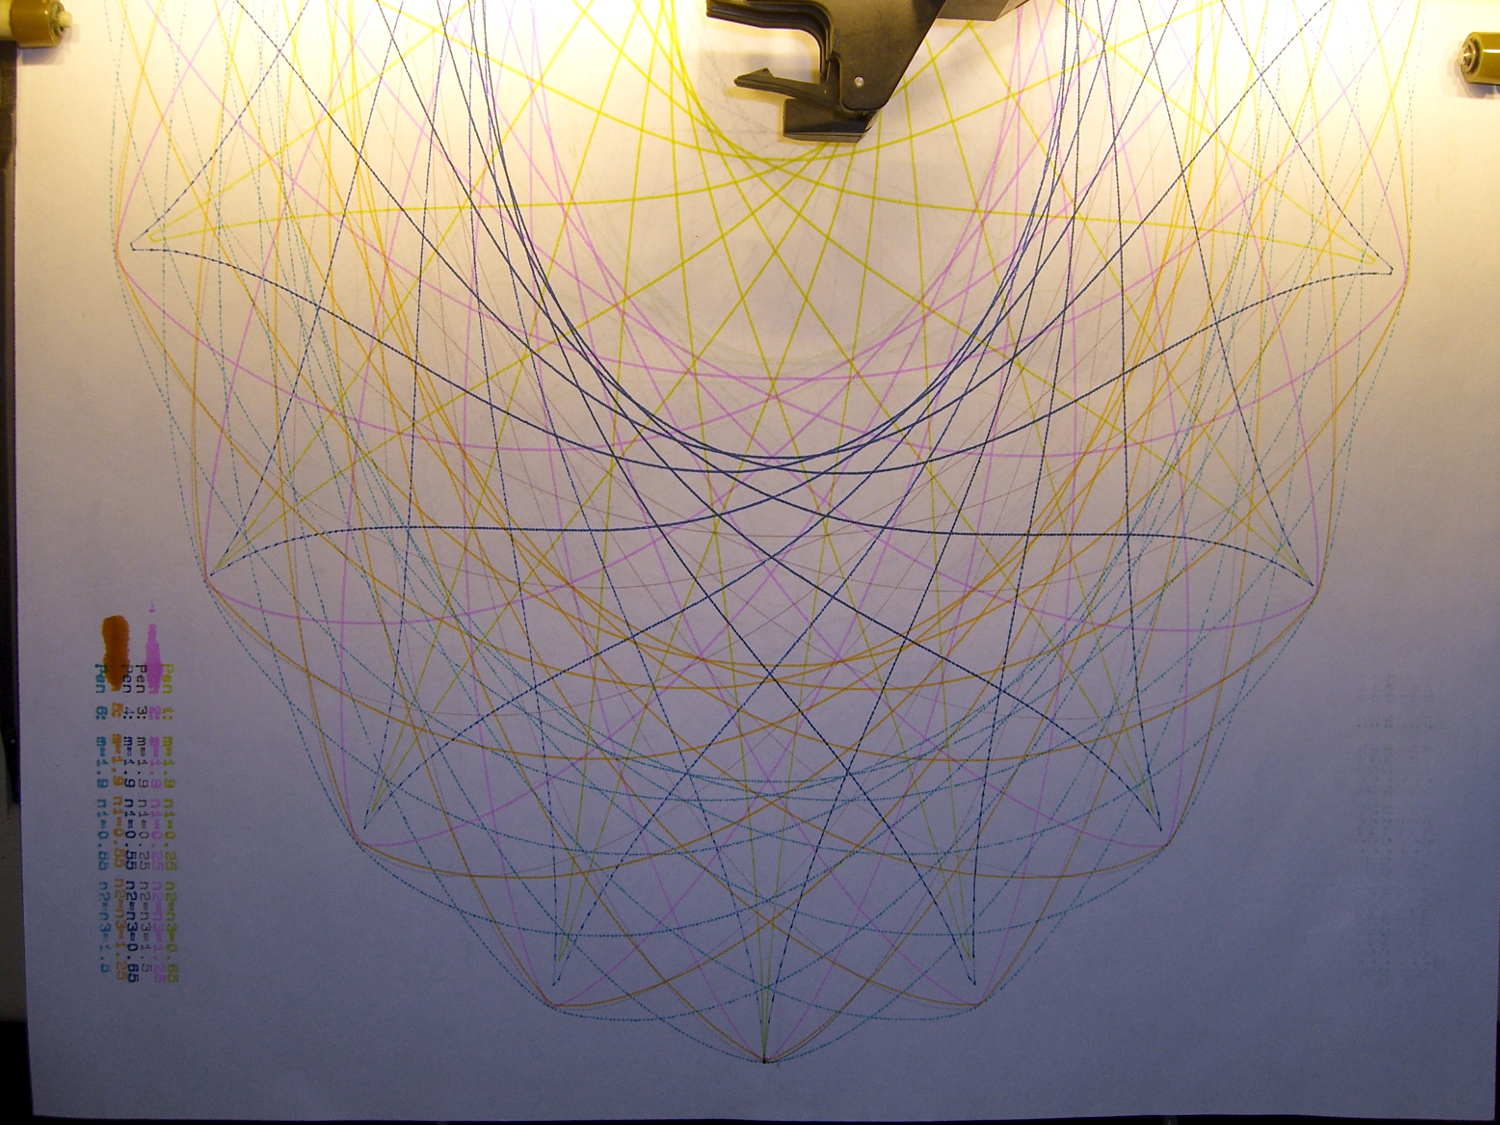
The blotches on the legend in the lower left corner show that a refilled plotter pen can accumulate a droplet of ink around its nib, which should come as no surprise. I wiped off the excess immediately after refilling each pen, let the assortment sit for a few hours to (presumably) let the new ink reach the nib, and wiped them off before inserting them in the plotter’s pen carousel. All I can say is that I used up a bunch of paper towels in the process…
A closer look at the plot shows Pretty Good If You Ask Me results:
CMYK Refilled Pens – plot detail
The two blue-ish pens have less flow than the others, resulting in dotted lines that should be continuous. As nearly as I can tell, that’s a function of how much OEM ink has solidified in the fiber nib and, most likely, the fiber rod that draws ink from the sponge reservoir inside the body.
And, of course, the colors produced by adding CMY printer ink to the surviving OEM ink aren’t found in any catalog. I’m also blithely ignoring the difference between the inks inside plotter pens intended for paper and those for overhead transparencies; at this late date, that’s defined to Not Matter.
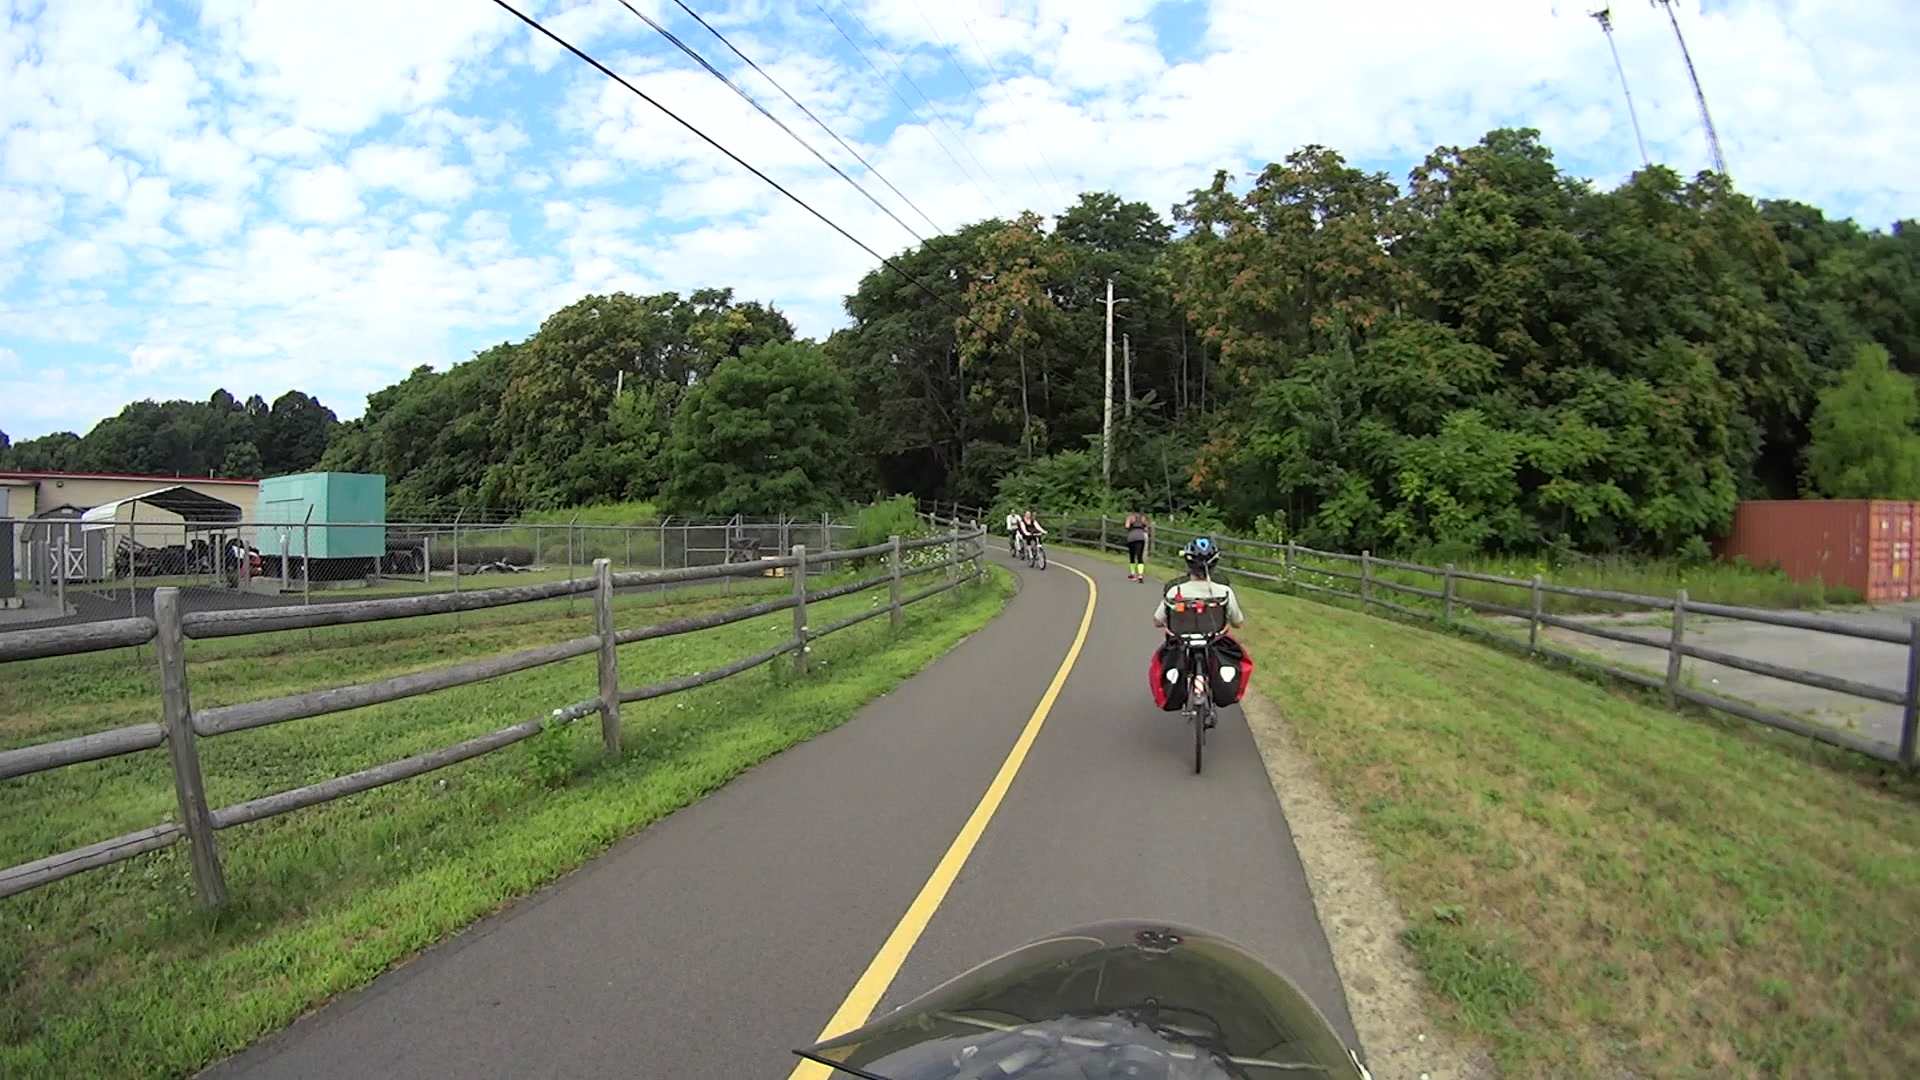
The Dutchess Rail Trail sits atop a pipeline carrying water from the treatment plant in the City of Poughkeepsie to the GlobalFoundries (neé IBM East Fishkill) complex. For good engineering reasons, the mid-line pumping station (equipment yard visible to our left) in Page Industrial Park sits directly athwart the pipe, which forced an abrupt S-curve on a relatively steep slope into the rail trail layout.
T=0.000 s — The lead cyclist just cut in front of her companion and isn’t leaning into the turn, at which point Mary and I both realize this isn’t going to end well:
Road Rash 2015-08-15 – 131
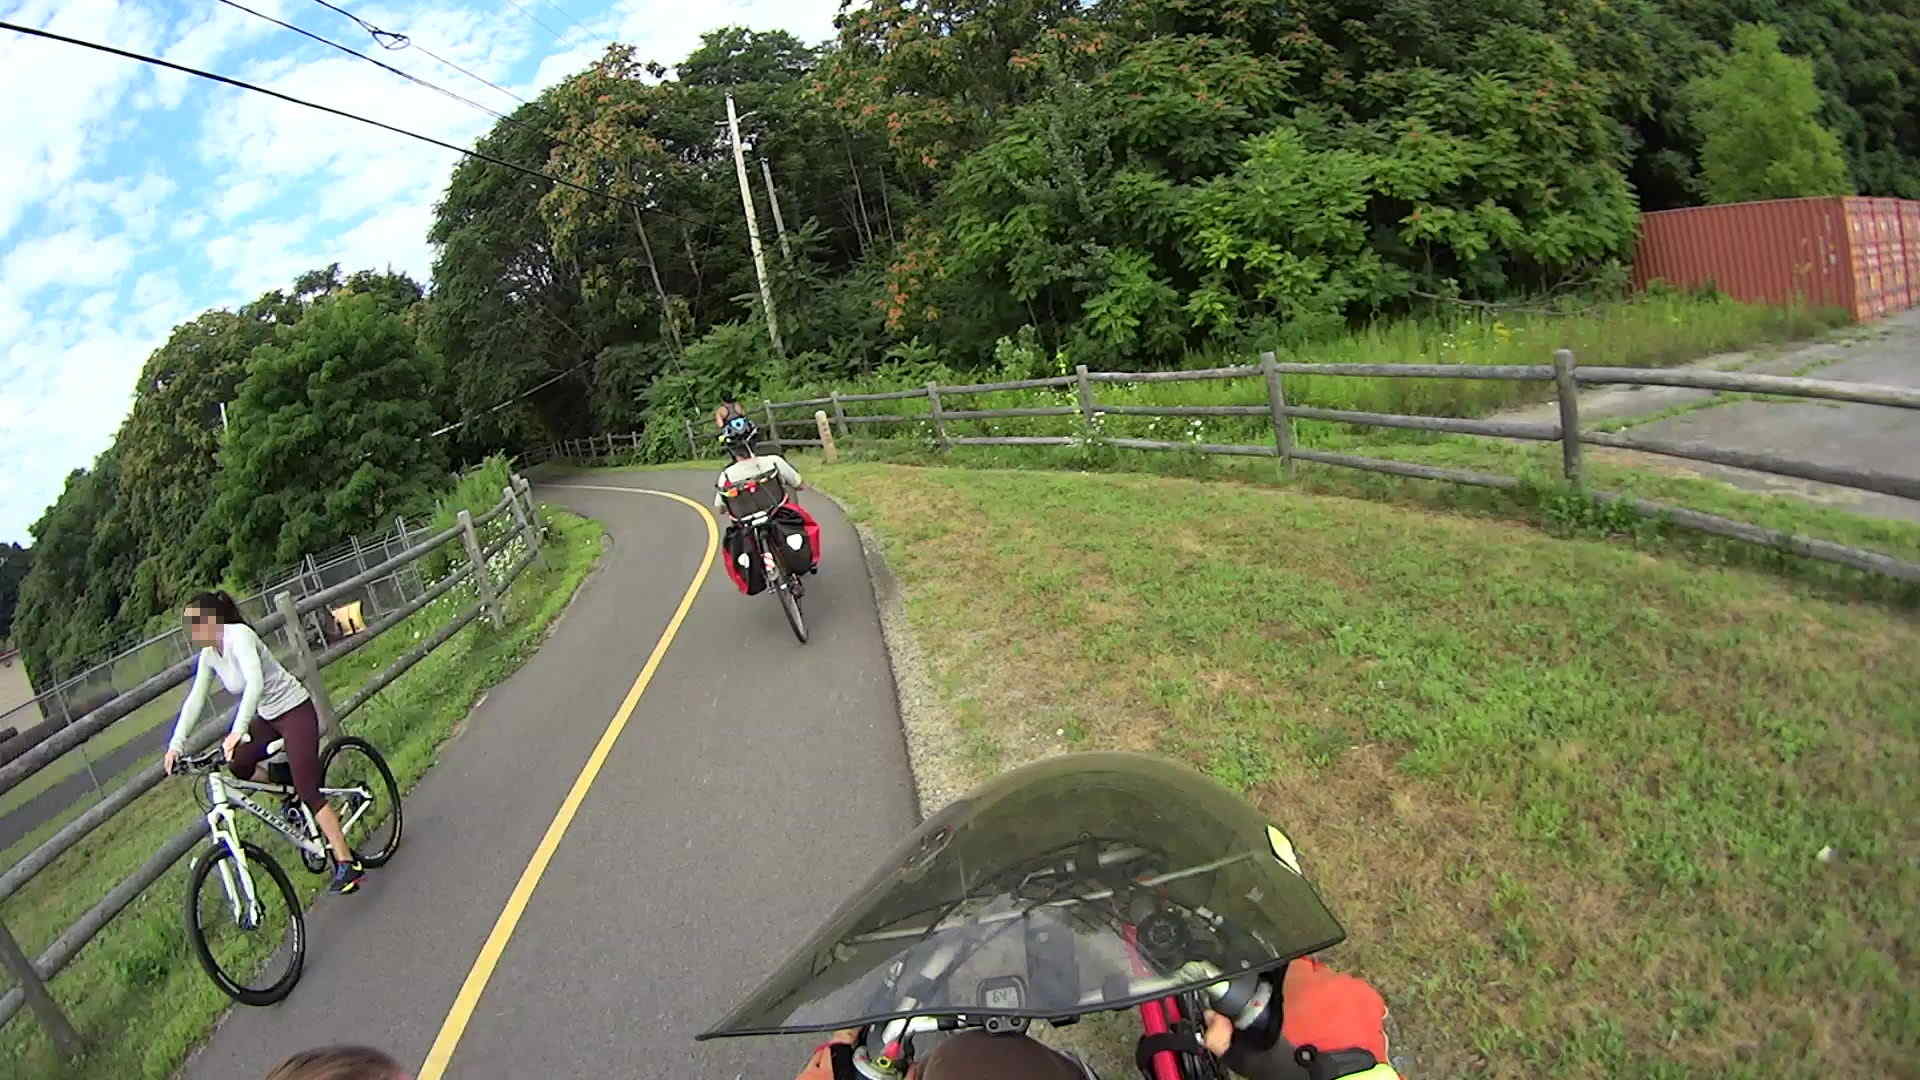
T=0.750 s — Newton grabs control of her bike and he’s not gonna let go:
Road Rash 2015-08-15 – 176
T=1.633 s — The rear wheel locks as she passes Mary, she’s far off-center and falling to her left, the bike has gone inertial, and it’s obvious we’re about to arrive at the same place at the same time:
Road Rash 2015-08-15 – 229
T=2.100 s — Collision Alarm! I’m veering off the pavement, which is the only reason we didn’t have an offset frontal collision:
Road Rash 2015-08-15 – 257
T=2.333 s — Impact! I’m stopped and balanced on the bike, with my left foot out of the pedal cleat and heading for the ground. She’s sliding past me, pivoting around her bike’s left pedal skidding on the asphalt:
Road Rash 2015-08-15 – 271
She ended up sprawled atop her bike, facing up the slope, with the front wheel just beside the rear wheel of my bike; her foot or some part of her bike whacked my left-side underseat bag in passing, but there was no bike-on-bike collision. No injuries for her, other than perhaps a bit of road rash, but only by sheer raw good fortune.
Reviewing the video shows she lost control at the transition from the trail to the downward S-curve, a few seconds before the first picture here and about five seconds before she stopped sliding past my bike, but the problem wasn’t obvious until the scene in the first picture. Mary never had a chance to react and, with less than two seconds until the not-quite-collision, my gross-motor reaction time just barely got me out of the way.
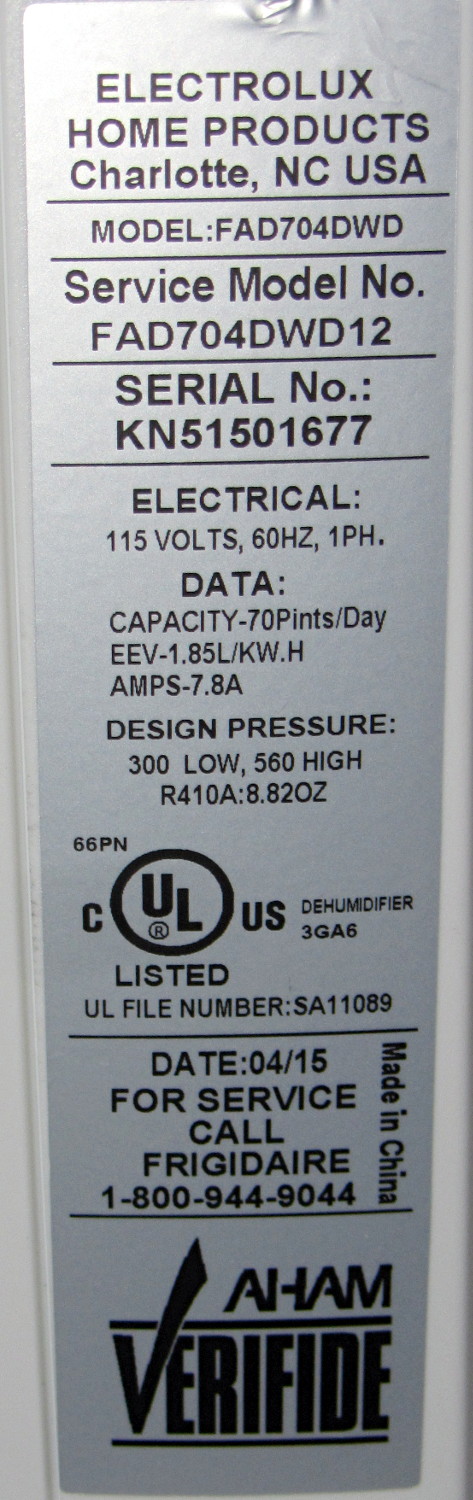
The step change in Week 22 shows when the replacement took over. After some poking around, Amazon Prime FTW.
The square-ish pulse starting in Week 26 marks a change from 55% RH to 60%RH and back again, to see how the front panel meter compares with the low end lab-grade hygrometer in the other side of the basement near the Hobo datalogger on the water inlet; they’re all off by a bit, but well within their expected tolerances. The 5% RH height of the step suggests a good match between their incremental calibrations.
It seems dehumidifiers last a few years, no matter which Brand Name you’ve decided to trust, so there’s not much point in developing a deep emotional attachment.
For the record, the old dehumidifier sported a GE label:
As it turns out, Electrolux bought Frigidaire a while ago, then absorbed GE’s appliances in 2014, so they’re all one big happy family now.
The various names notwithstanding, a recall notice suggests Gree Electric actually makes all the dehumidifiers badged with Brand Names you might think represent something significant.
Given the ionization chamber’s tiny currents and the huge resistors required to turn them into voltages, reviewing the thermal noise I generally ignore seems in order…
The RMS noise voltage of an ordinary resistor:
vn = √ (4 kB T R Δf)
The constants:
kB – Boltzman’s Constant = 1.38×10⁻²³ J/K
T – temperature in kelvin = 300 K (close enough)
Mashing them together:
vn = √ (16.6x10⁻²¹ R Δf)
vn = 129x10-12 √ (R Δf)
For a (generous) pulse current of 20 fA, a 10 GΩ resistor produces a mere 200 μV, so wrap a gain of 100 around the op amp to get 20 mV. An LMC6081 has a GBW just over 1 MHz, giving a 10 kHz bandwidth:
vn = 129x10-12 √ (10x109 10x103) = 1.3 mV
Which says the noise will be loud, but not deafening.
A 100 GΩ resistor increases the voltage by a factor of 10, so you can decrease the gain by a factor of ten for the same 20 mV output, which increases the bandwidth by a factor of ten, which increases the noise by a factor of … ten.
Ouch.
With the same gain of 100 (and therefore 10 kHz bandwidth) after the 100 GΩ resistor, the output increases by a factor of ten to 200 mV, but the noise increases by only √10 to 4 mV.
The LMC6081 has 22 nV/√Hz and 0.2 fA/√Hz input-referred noise, neither of which will rise above the grass from the resistor.
It’s a good thing I have a pretty deep parts stock, as one of the caps didn’t fit into its holes at all.
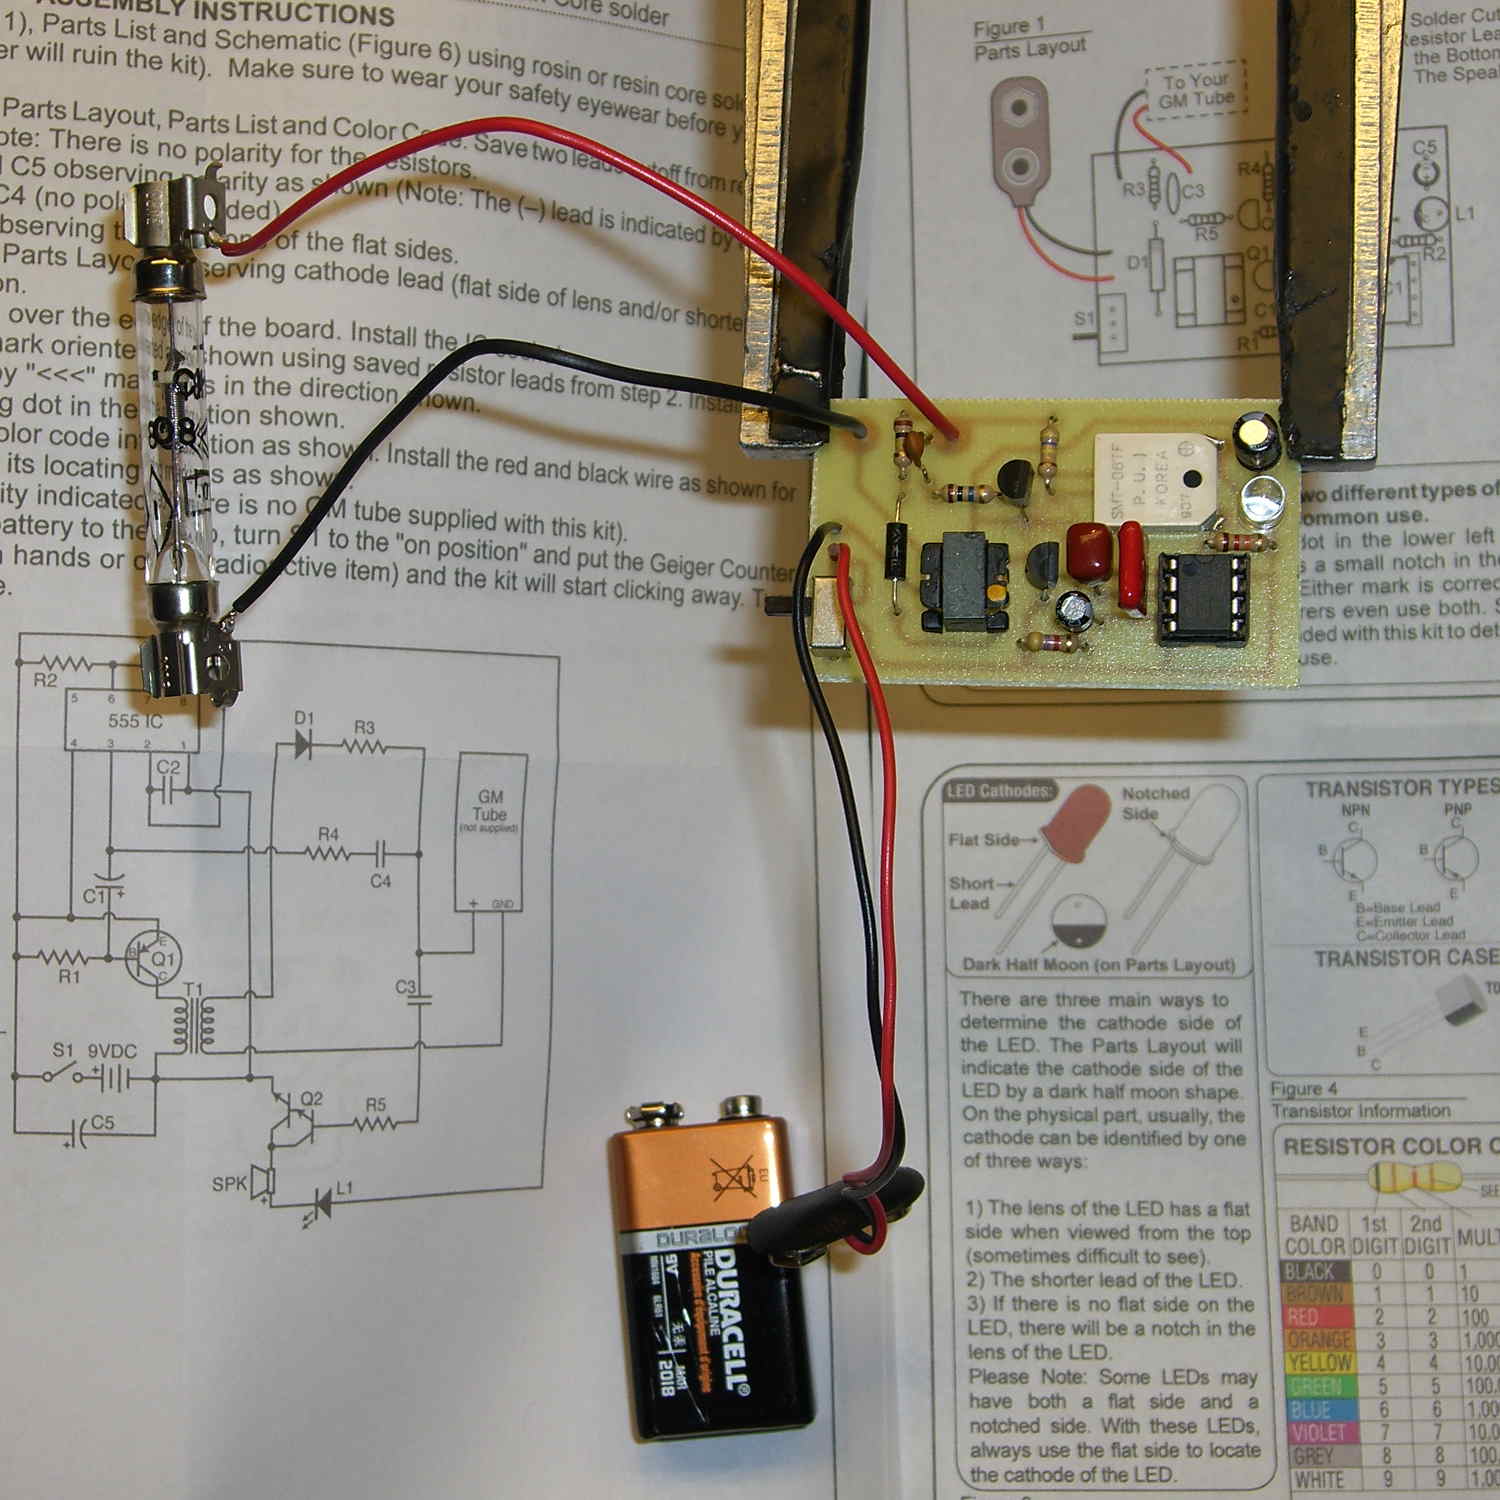
The Russian CI-3BG glass tube, according to the datasheet and discussion on MightyOhm, is sensitive to gamma and beta radiation, so it should serve as a simple cross-check on my ionization chamber results. It’s not clear the C8600 is applying the correct voltage to the CI-3BG tube, but it probably doesn’t make much difference; the supply is so feeble that there’s no way to actually measure the results.
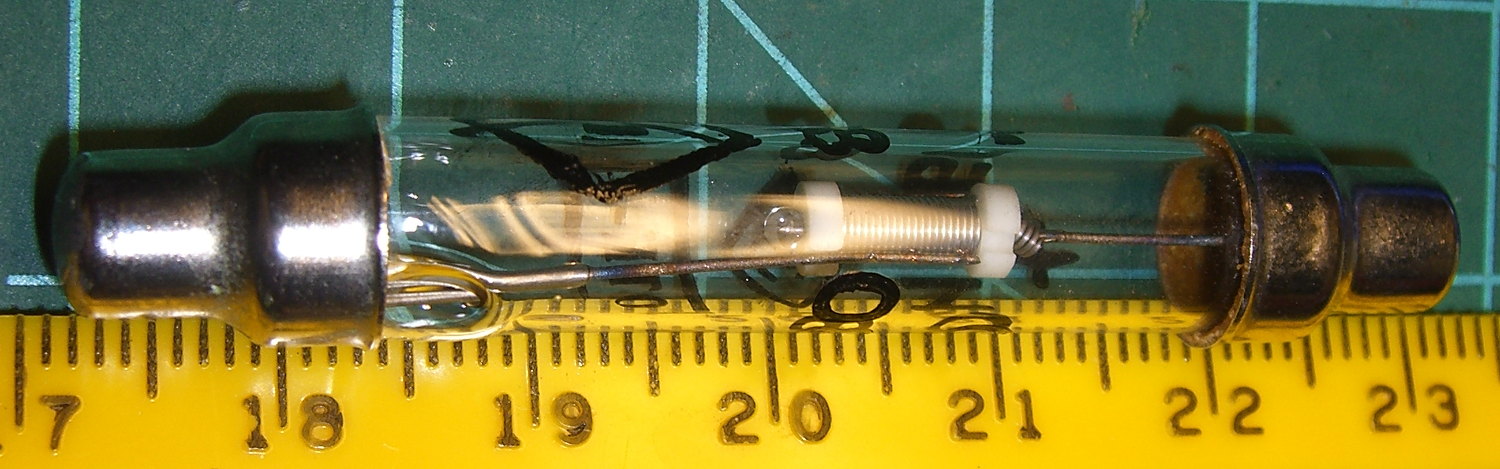
A closer look at the CI-3BG suggests the active volume lies inside that spiral-wrapped section between the white insulators:
Russian CI-3BG Glass Geiger Tube – detail
In round numbers, that section is 6 mm long and 3 mm OD. Figuring the ID at 2.5 mm, that’s a volume of 30 mm3 = 0.030 cm3. That’s maybe 1/7300 of the ionization chamber volume, so, (handwaving) assuming roughly equal sensitivity, the chamber should report three orders of magnitude more pulses than this little thing.
It’s mildly sensitive to a radium-dial watch and perks up when a watch hand lines up along the spiral-wrapped volume. Given that the radium decay sequence spits out betas and no gammas, the (scaled) count may be a bit higher than the ionization chamber produces, but there are so many other imponderables that it might not matter in the least.