Ed Nisley's Blog: Shop notes, electronics, firmware, machinery, 3D printing, laser cuttery, and curiosities. Contents: 100% human thinking, 0% AI slop.
Category: Science
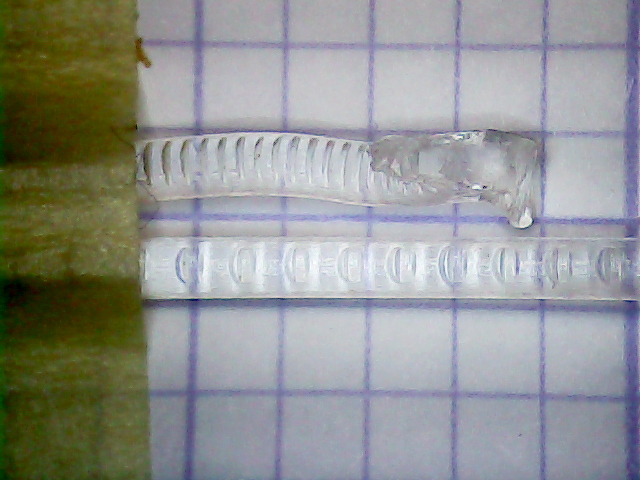
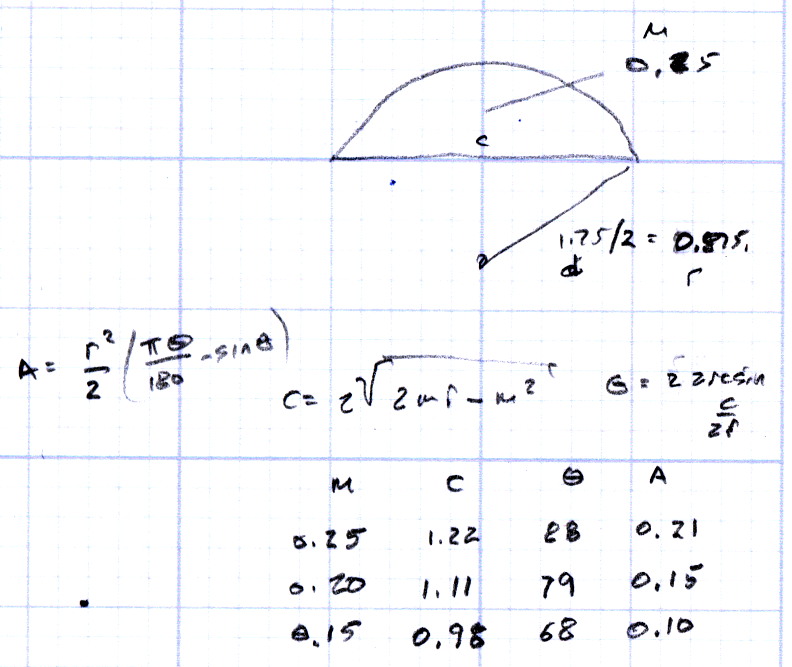
If you measure something often enough, it becomes science
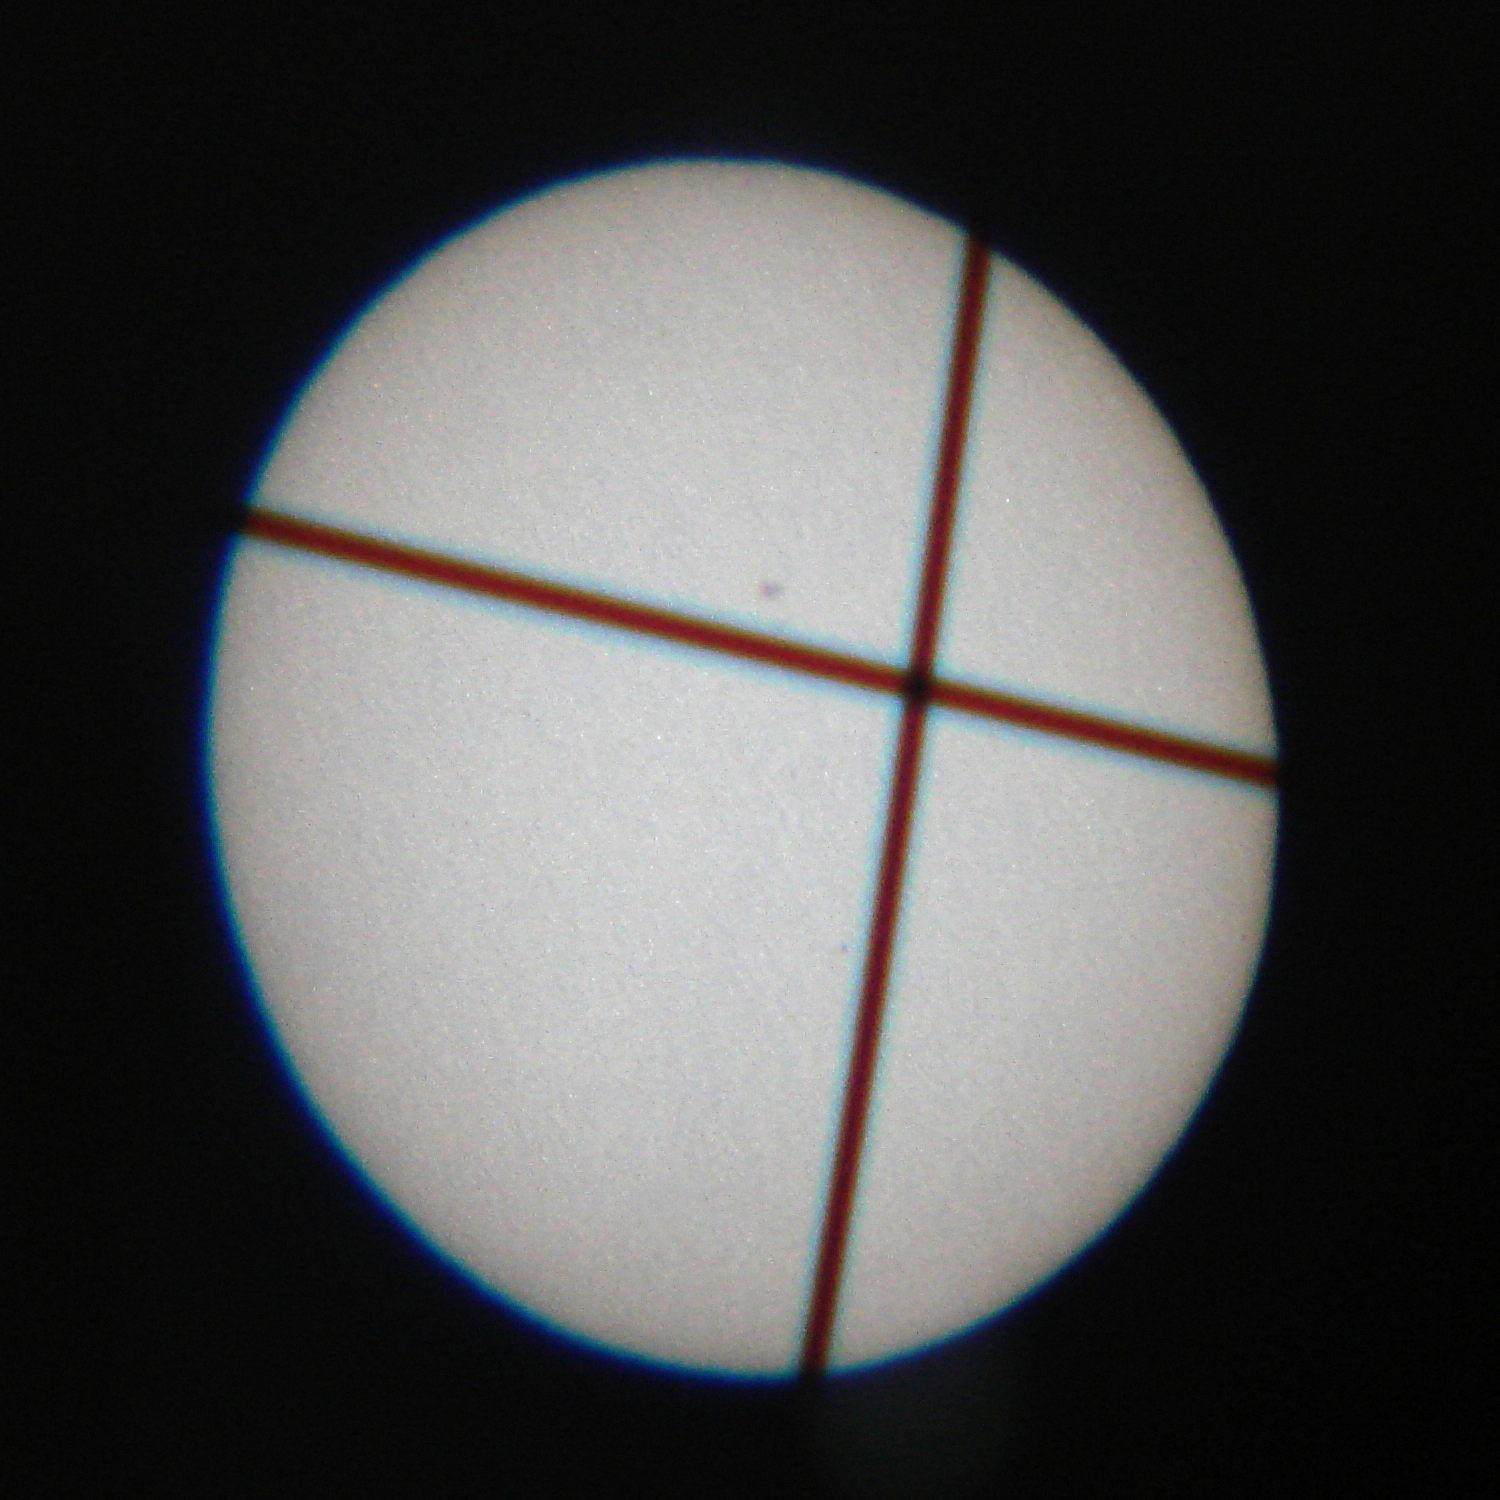
If you know what you’re doing, you can measure the size of the sun and scale the entire solar system from observations like that. Takes more science than I’ll ever accomplish, that’s for sure!
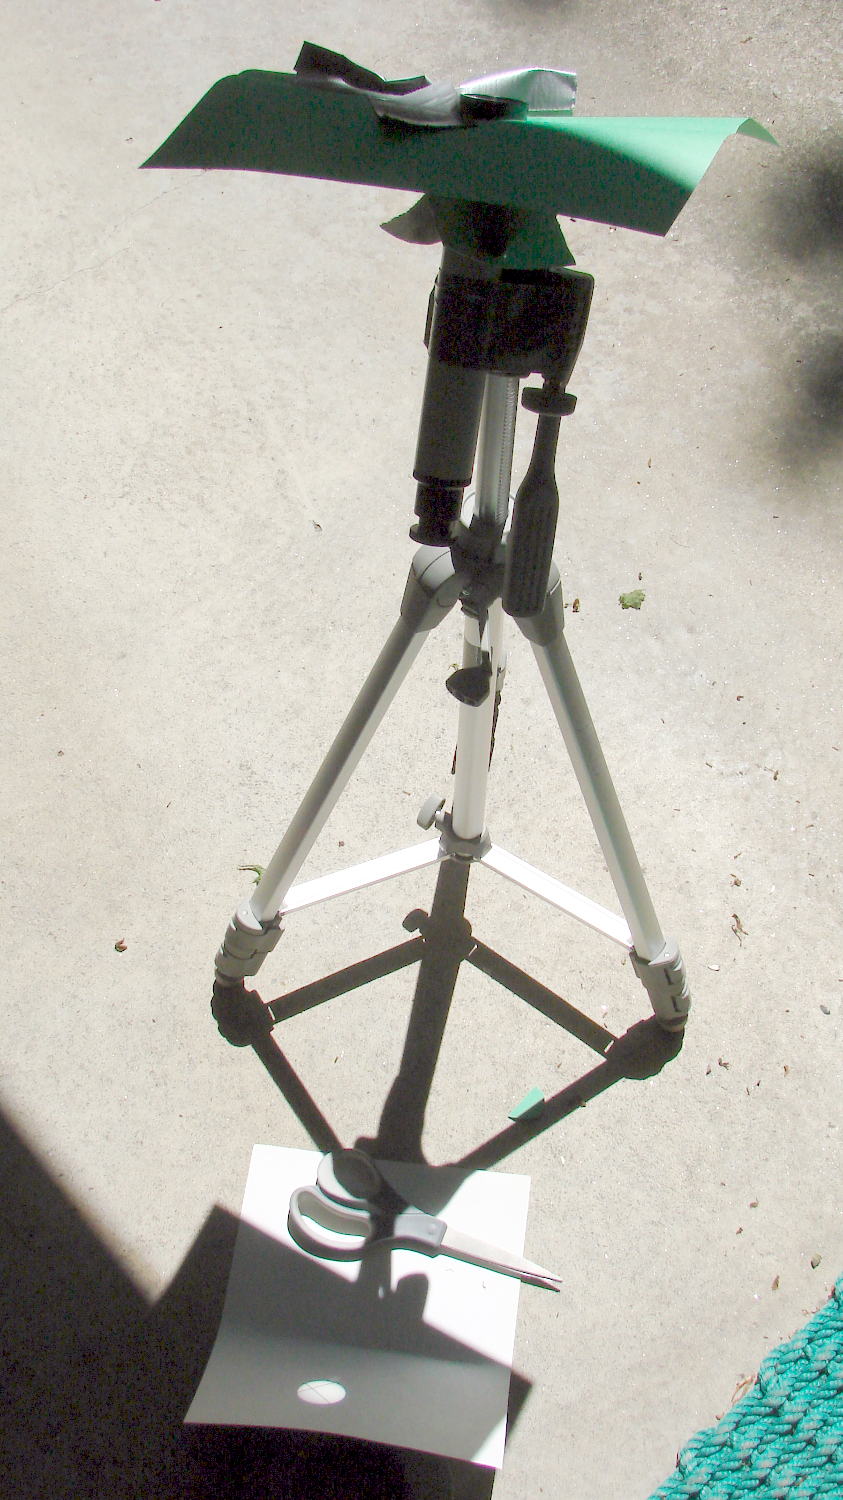
I realized the show was on just before Greatest Transit (roughly what you see above), so I duct-taped a 1 inch spotter / finder scope to a camera tripod, taped a sun shield on the scope, bent some card stock for a screen, then assembled everything on the patio:
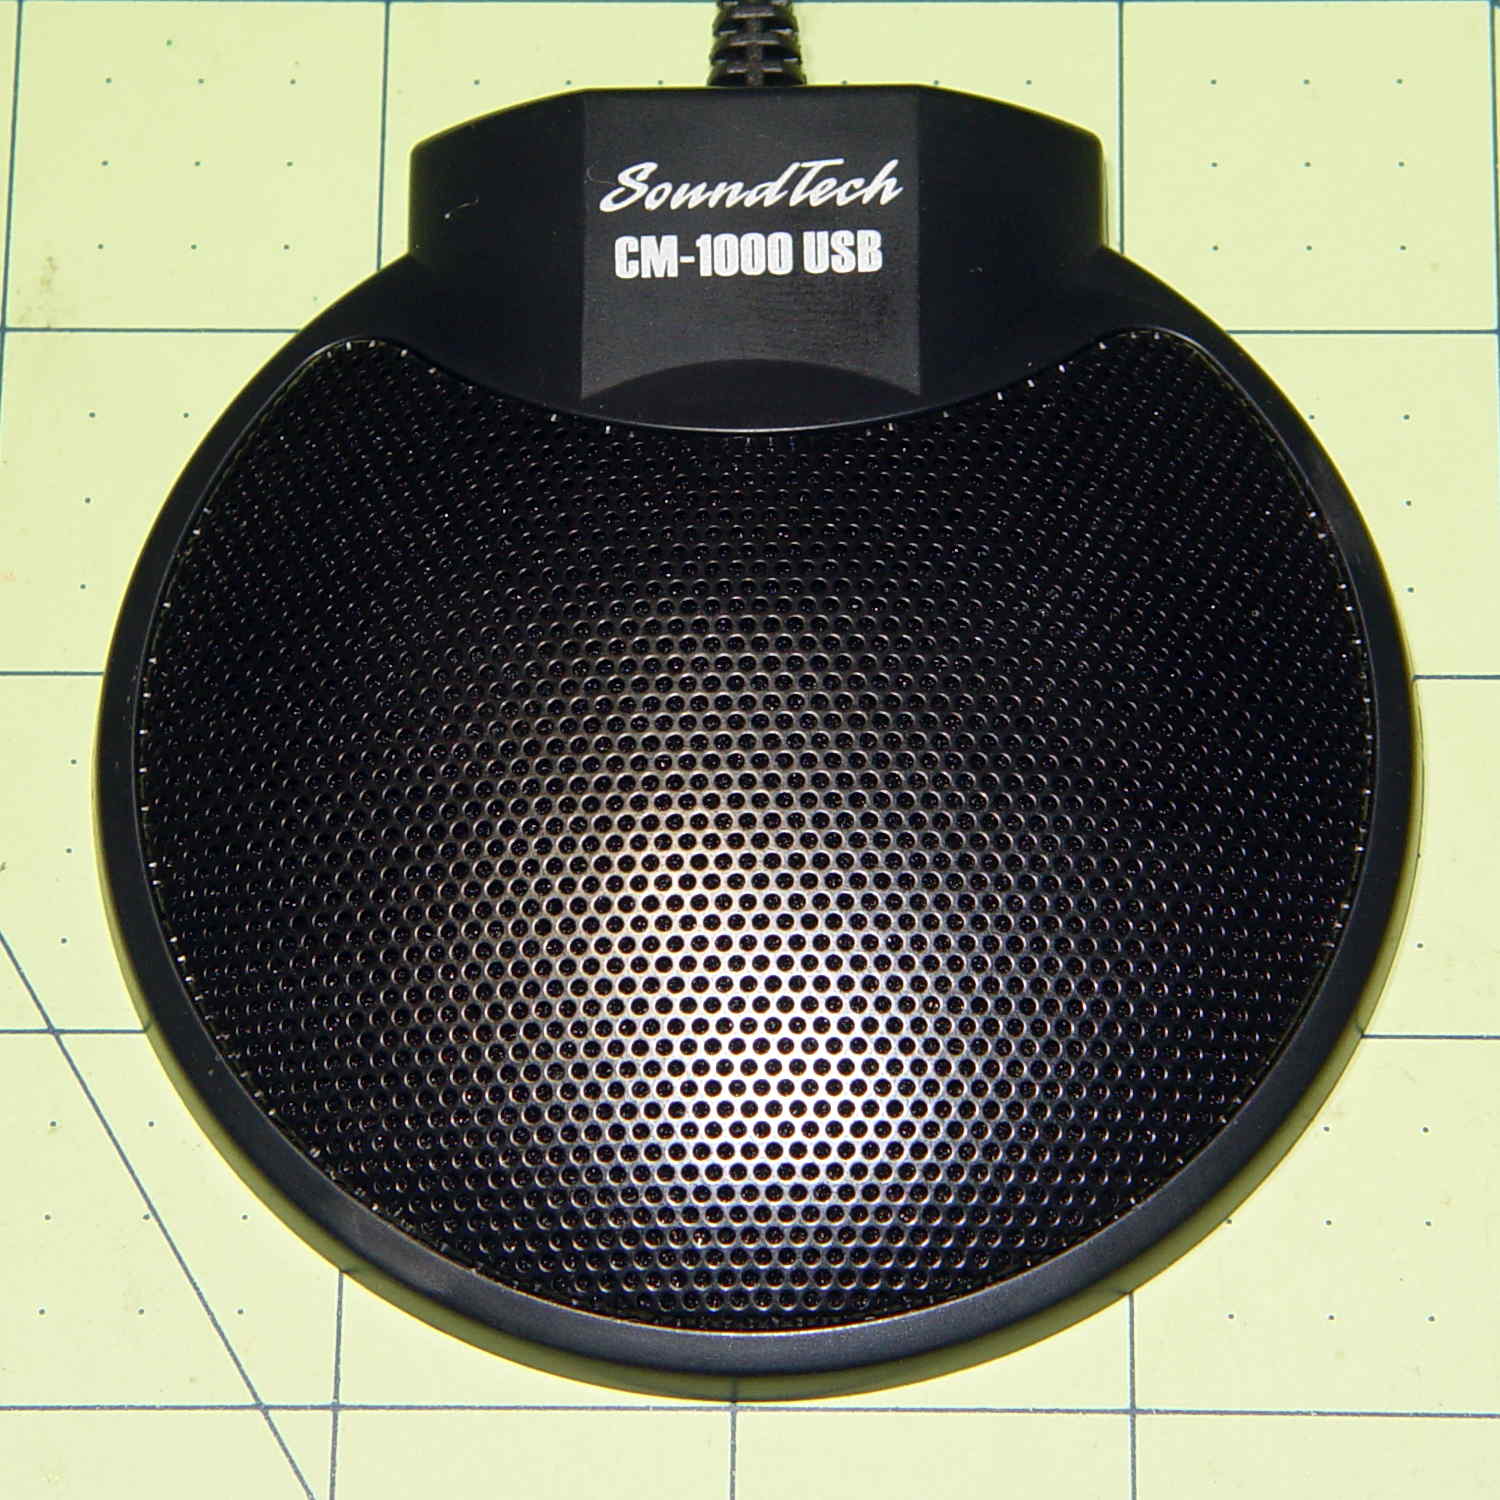
Although microphones intended for conference tables aren’t suitable for inconspicuous hearing aids, they go a long way toward working out algorithms (*). This is a SoundTech CM-1000 USB mic:
SoundTech CM-1000USB microphone
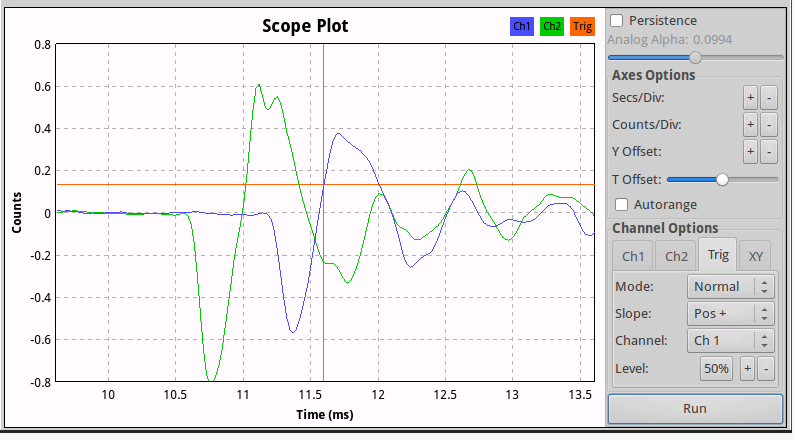
It produces noise-canceled stereo output and a quick test shows impulse sounds produce reasonable left and right responses responses; I can’t vouch for the noise cancelling part.
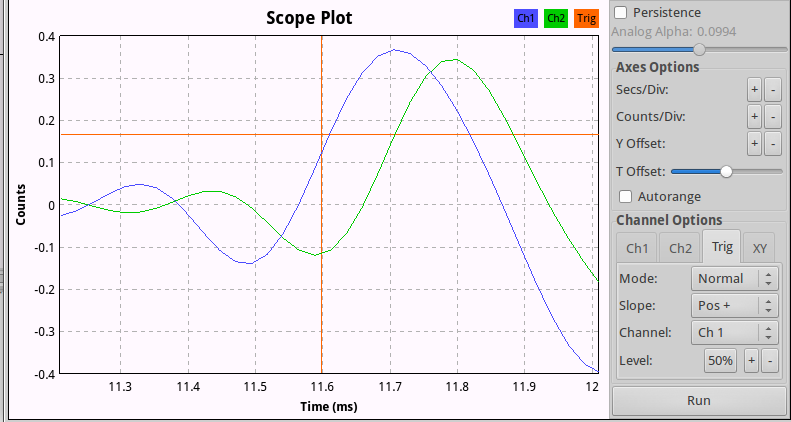
A click to the right side:
CM-1000USB mic – Right pulse
And to the left:
CM-1000USB mic – Left pulse
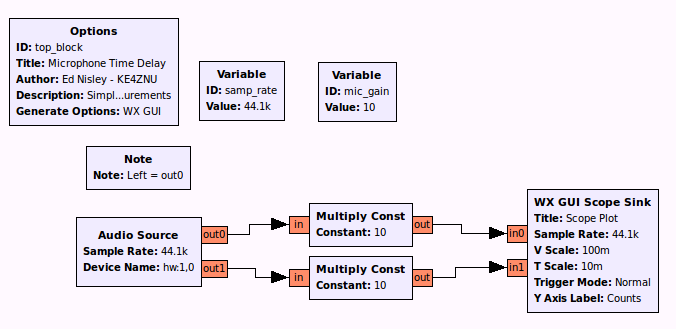
The green trace (Channel 2) is obviously the Right channel, which corresponds to in1 on the Scope Sink block and out1 of the Audio Source in the GNU Radio data flow diagram:
Microphone Time Delay.grc
There’s an irreconciliable clash between 0-index and 1-index numbering in there, but the microphone’s “Left” and “Right” channels appear in the proper places when you look at the mic from the conference room side of the label as shown in the top photo.
Figuring the speed of sound at 344 m/s, that 100 µs delay means the mic capsules sit 34 mm apart, which looks to be about right, as the flat part of the housing under the label spans 22 mm.
That’s a tad skimpy for things like beamforming and direction finding, so I actually bought a set with a separate CM-1000 mic that plugs into the USB mic:
SoundTech CM-1000USB and CM-1000 microphones
The channel layout diagram explains what’s supposed to happen:
Soundtouch CM-1000USB microphone channel layout
The additional mic changes the response, so that the USB unit becomes the Left channel and the analog mic provides the Right channel. I don’t know what happens to the “noise canceling” part of the story.
With the mics positioned 200 mm on center, a click to the right side:
SoundTech CM-1000 mics – 200 mm OC – Right pulse
The eyeballometrically precise 600 µs delay corresponds to 206 mm at 344 m/s, which might actually be close: they’re 200 mm on center, but the Right-channel mic is 10 mm smaller and the mic might be half that much further away from the other one. Not that that makes any difference.
(*) And, frankly, slapping a mic on the table won’t bother me much at all…
The audio test CD I used to measure my hearing for a Circuit Cellar project back in 2007 came to light, so I ran some tests:
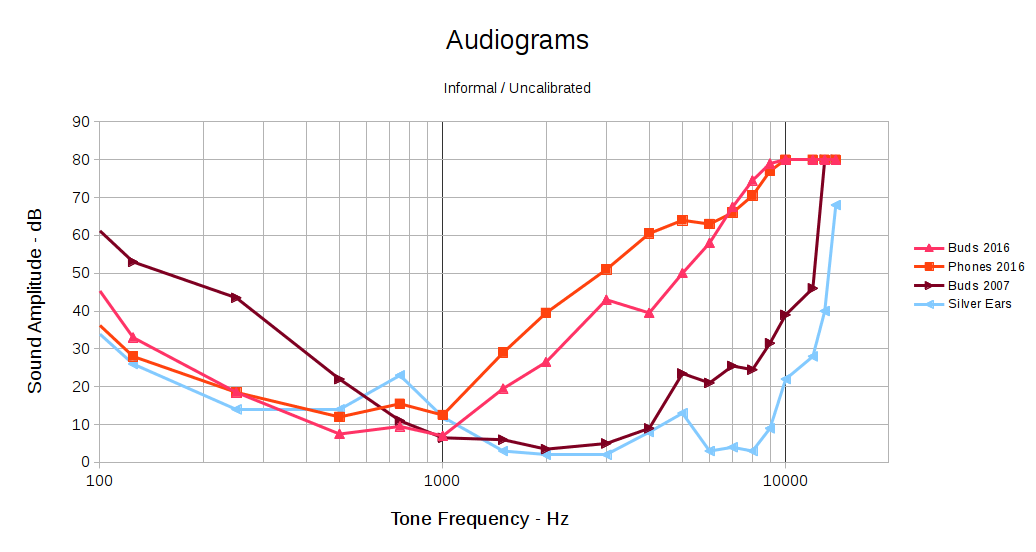
Audiograms
I don’t have an absolute level calibration for any of those curves, so they can be shifted up or down by probably 10 dB without any loss of accuracy. The overall shape matters here, not the absolute level.
The brown curve shows my hearing as of nine years ago. I built and (of course) wrote about a rather chunky low-pass shelving filter that matched the 20-ish dB difference between my midrange and treble responses, then boosted the flattened result enough for me to hear what I was missing:
Board Top
Surprisingly, it worked fairly well. That, however, was then and this is now.
The two red curves show my current response, under slightly different conditions: the “buds” curve uses the same earbuds as the 2007 curve and the “phones” curve uses over-the-ear headphones. Perhaps:
The previous (lack of) bass sensitivity came from the circuitry of the day
My bass has mysteriously improved
More likely, my midrange has gotten that much worse
The blue curve shows the response of a reference set of silver ears; the golden ears I used in 2007 were unavailable on short notice.
Given my limited bandwidth and the steep slope of that curve out toward the high end, simply fixing my (lack of) treble won’t suffice any longer: 50 dB is a lot of amplification. Compressing the bandwidth between, say, 200 Hz and 4 kHz to fit into 200 Hz to 2 kHz, then equalizing the result, might give me enough treble to get by, but it’d require re-learning how to hear.
That’s different from the straightforward frequency translation you get from a mixer. I don’t have enough audible bandwidth around 1 kHz to hear a 4 kHz slice of audio spectrum.
Back in 2007-ish, a real audiologist determined that I wasn’t “aid-able”. Maybe that’s changed.
The economics seem daunting. Michael Chorost gave a talk at Vassar lamenting the cost and terrible UX of his cochlear implants that reinforced my prejudices in that area. The discussion following my post on my Bose QC20 earphones includes useful links and rants.
The GNURadio project has enough signal-processing mojo for a nontrivial hearing aid, modulo having enough CPU power at audio frequencies. Battery power density remains the limiting factor, but I’m not nearly as fussy about appearances as most folks and some full-frontal cyborg wearables might be in order.
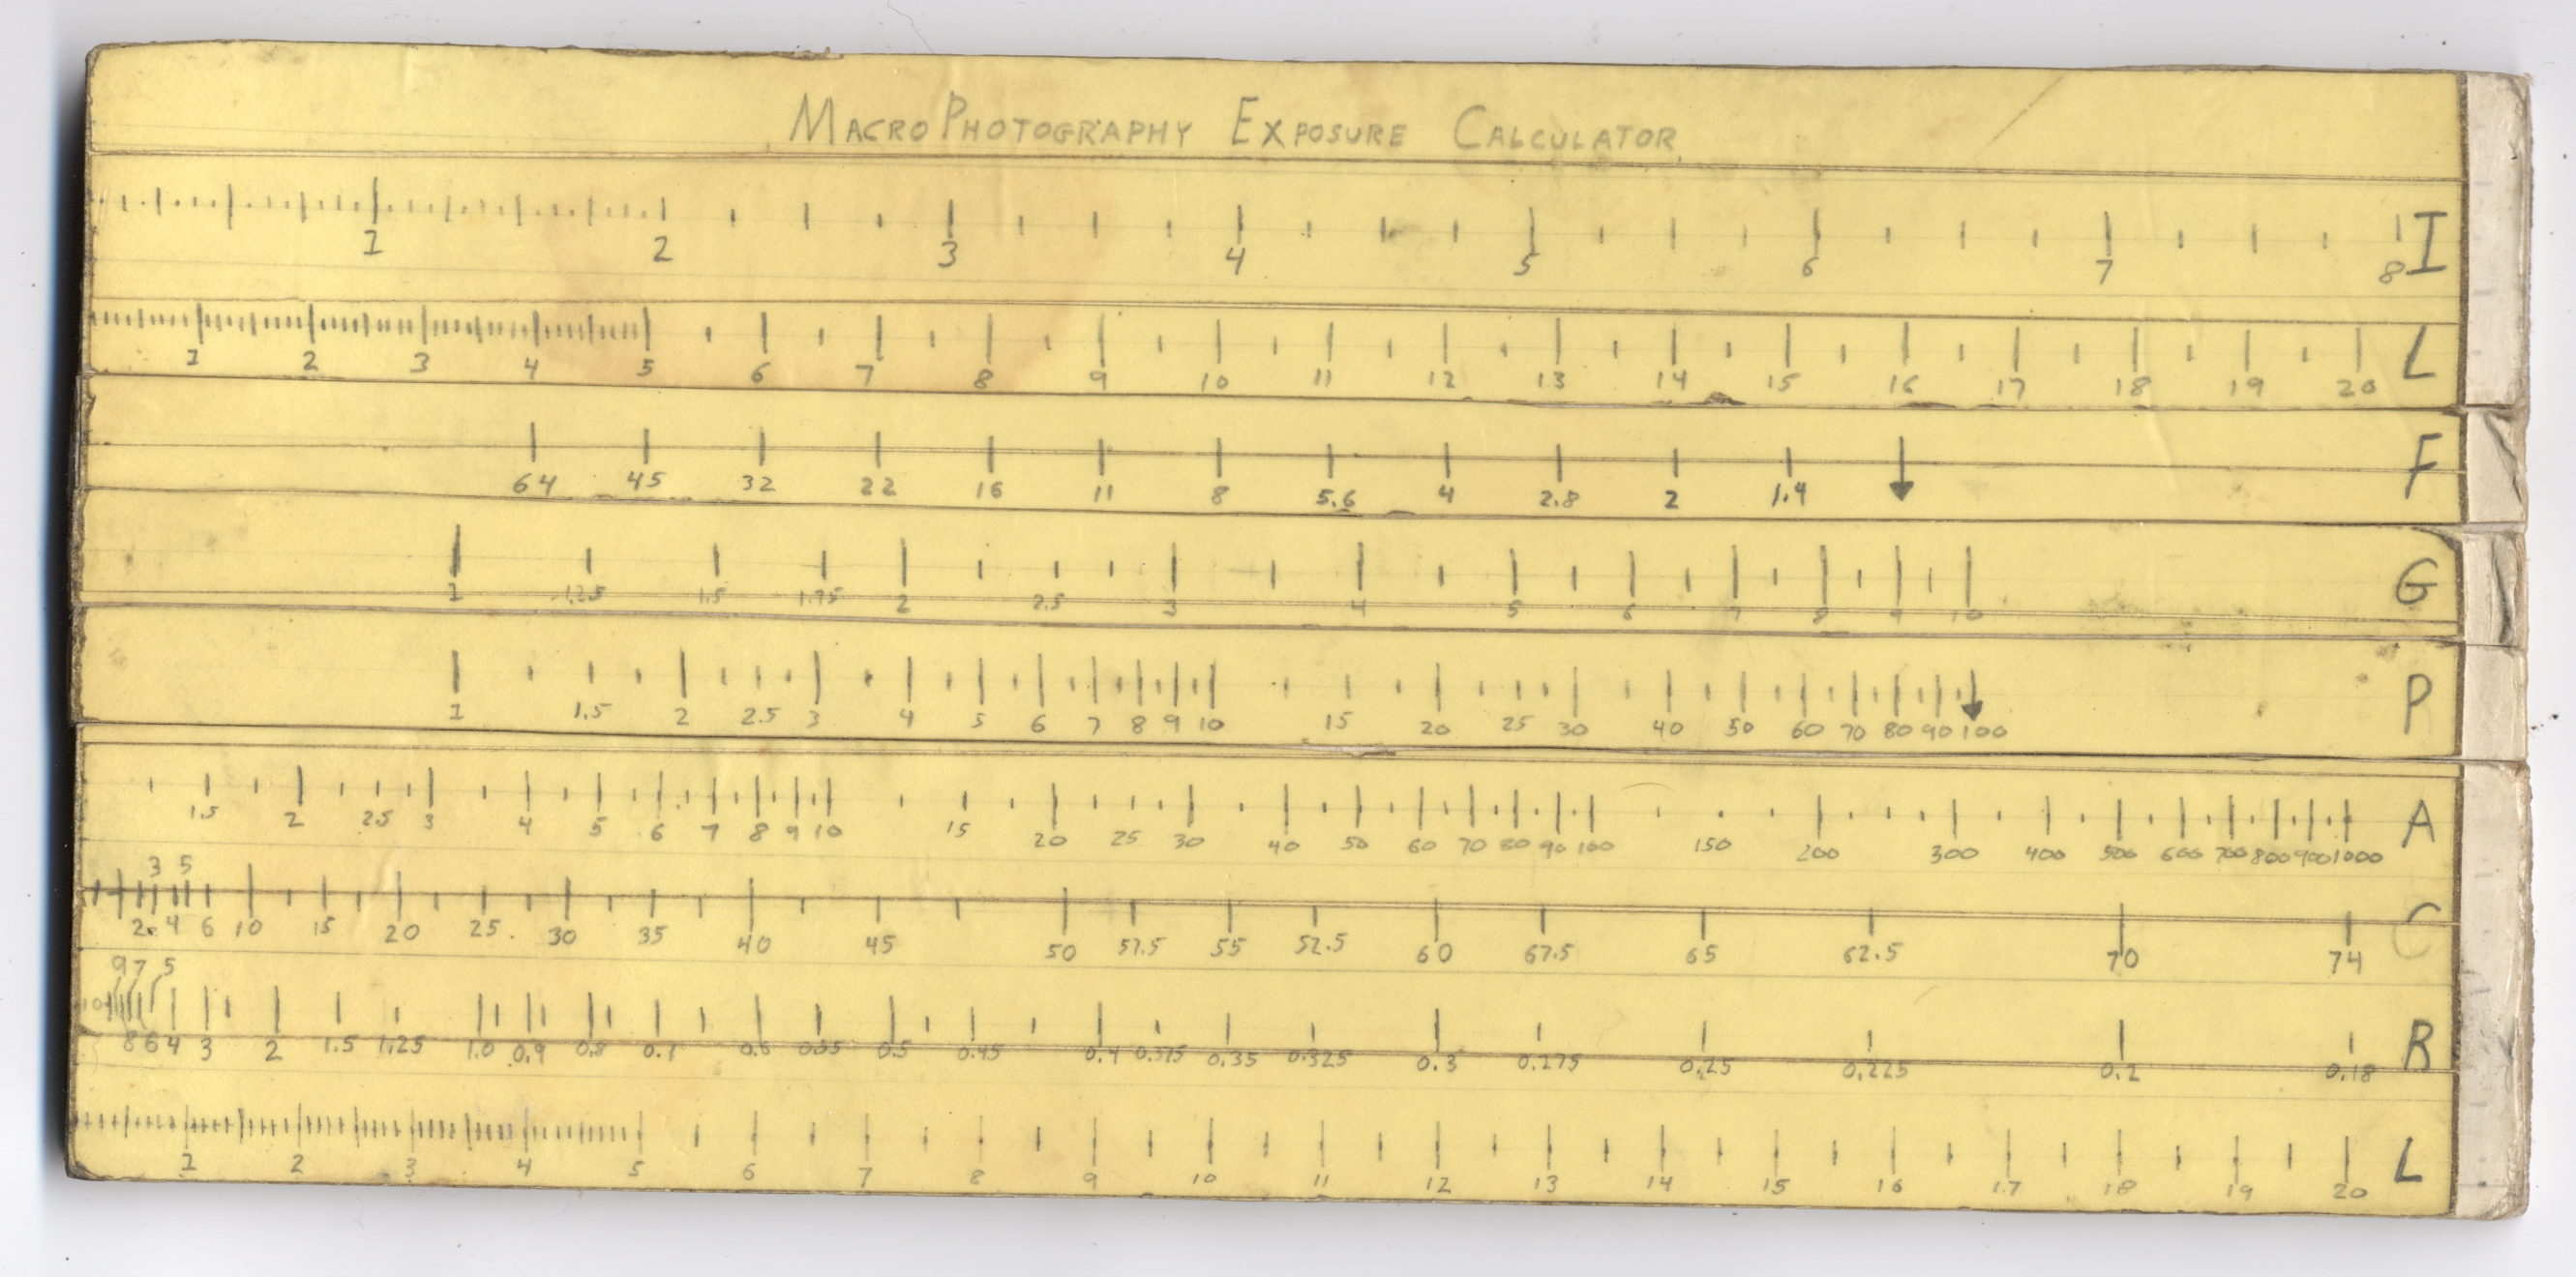
Back in high school, I designed and built a slide rule exposure calculator to improve my macro photographs:
Macrophotography Exposure Calculator – front
The base consists of three layers of thin cardboard glued together with Elmer’s Glue. The three slides have three layers of thinner white cardboard glued together, with offsets forming tongue-and-groove interlocks, topped with yellow paper for that true slide rule look:
Judging from the seams, I covered the hand-drawn scales with “invisible” matte-surface Scotch Tape. Worked well, if you ask me, and still looks pretty good:
Macrophotography Exposure Calculator – front – detail
The reverse side carries instructions under a layer of packing tape (which hasn’t survived the test of time nearly as well), for anyone needing help:
The slides still move, albeit stiffly, and it might be usable.
I vaguely recall extension tubes on an early SLR, but memory fades after that. Getting the exposure settings close to the right value evidently posed something of a challenge and, given the cost of 35 mm film + development, it made sense to be careful.
Fortunately, even today’s low-end cameras make macro photography, at least for my simple needs, easy enough, with the camera handling the exposure calculations all by itself:
“… One of the most frightening things about your true nerd, for many people, is not that he’s socially inept — everybody’s been there — but rather his complete lack of embarrassment about it.”
“Which is kind of pathetic.”
“It was pathetic when they were in high school,” Randy says. “Now it’s something else. Something very different from pathetic.”
“What, then?”
“I don’t know. There is no word for it. You’ll see.”
So I found two copies of the US Army’s Demolition Card GTA 5-10-9 tucked under a row of completely unrelated books in the Basement Laboratory (clicky for more dots):
One can only hope it’s slightly more useful than the Calculator Set, Nuclear, M28 — FSN 6665-897-8697 on another shelf. It dates back to the era when you could get ammonium nitrate that went blam when prompted; rumor has it that retail fertilizer now comes with built-in detonation inhibitors.
Essentially all adult human males have a story including the phrase “but for an (inch | second), I wouldn’t be here” … it’s a survivor bias thing.
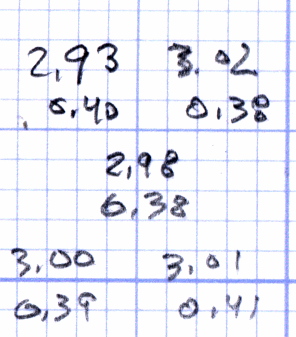
Five single-thread thinwall boxes scattered across the platform had an average height of 2.99 mm, with a range of +0.04 mm, -0.06 mm:
Thinwall open box – 1 thread walls
The wall widths work out to 0.39 mm, with a range of +0.2 mm, -0.01 mm.
Close enough, given that I can’t recall the last time I tweaked the platform height. I update the filament diameter setting in Slic3r every now & again as the printer gradually works through the spool, but, with one exception, this cyan PETG has been quite consistent and my tweaks didn’t really amount to much.
Frankly, given that any of the measurements may be off by ±0.02, the best I can hope for is an overall warm fuzzy feeling. When the printed results stop looking good, these results will (probably) provide some indication of whatever just changed.