Ed Nisley's Blog: Shop notes, electronics, firmware, machinery, 3D printing, laser cuttery, and curiosities. Contents: 100% human thinking, 0% AI slop.
Category: Science
If you measure something often enough, it becomes science
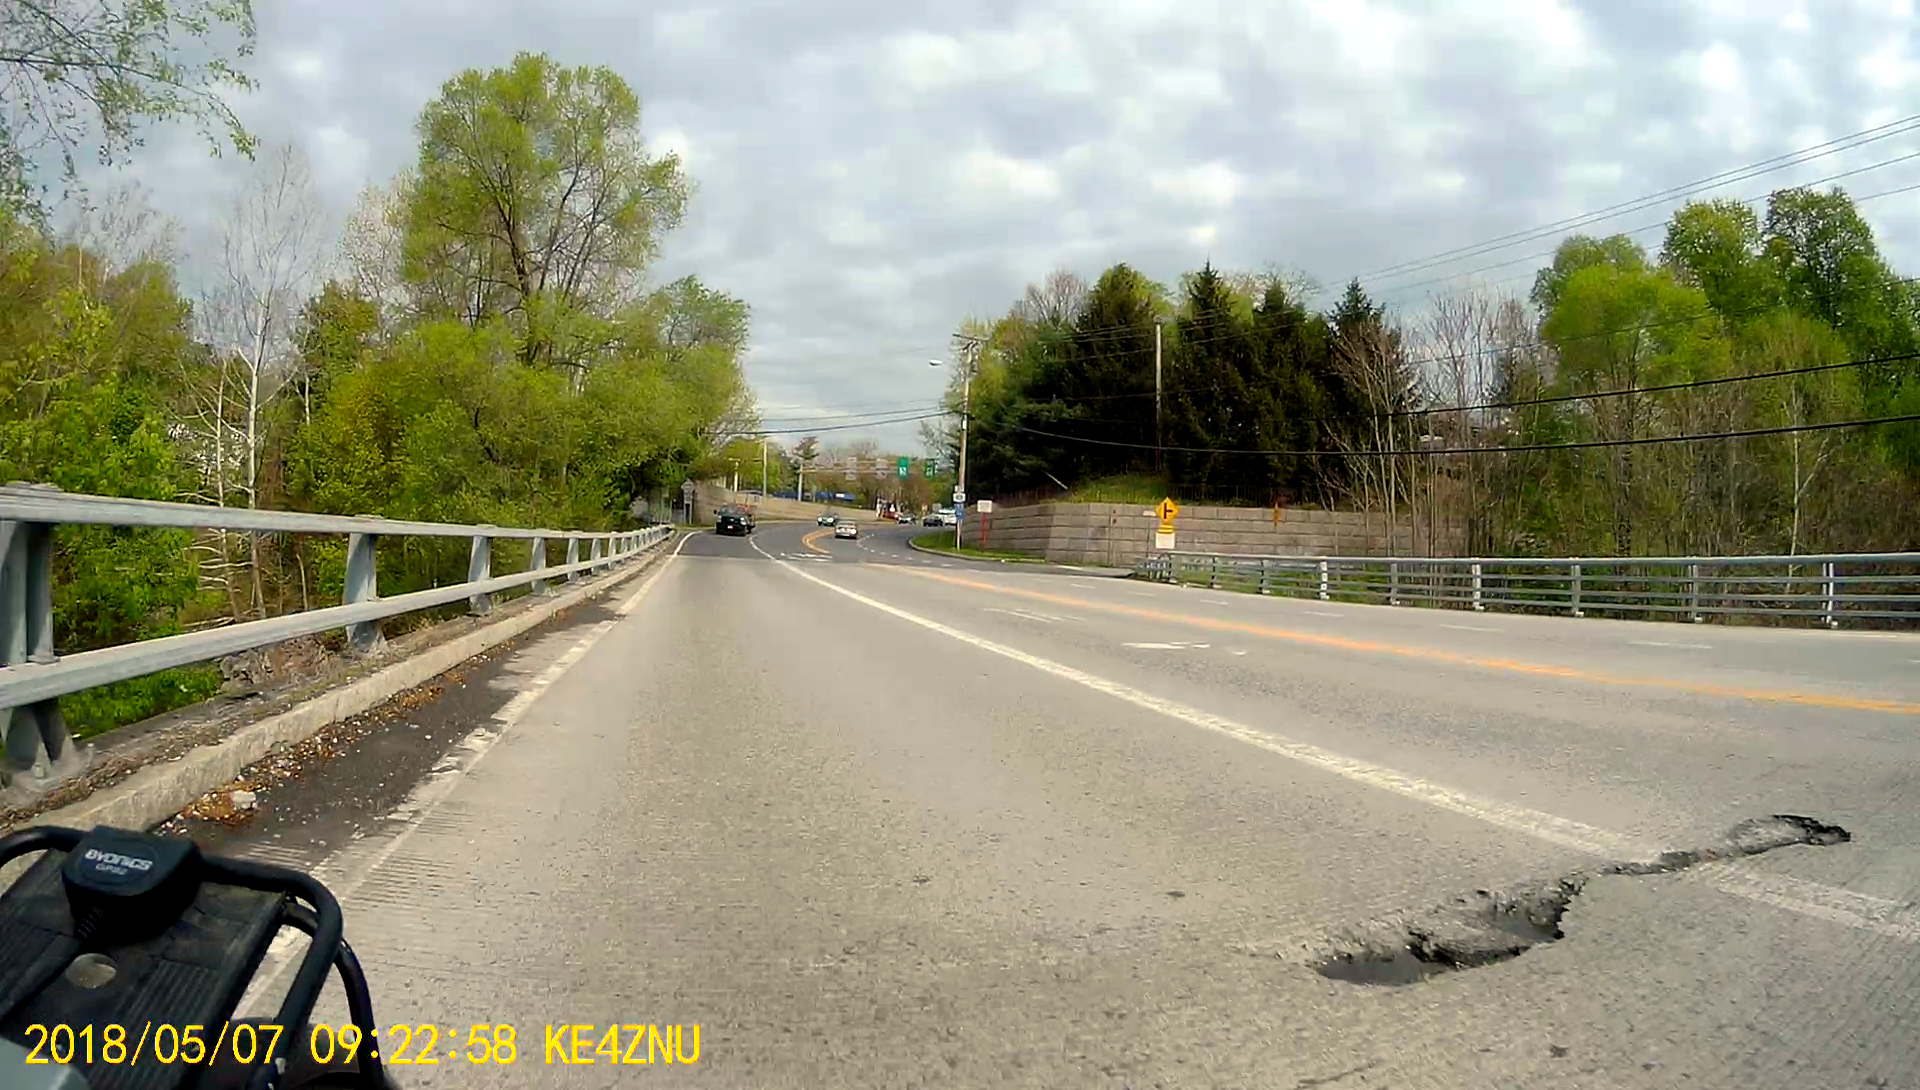
The downspouts are obviously more recent than the splash blocks, but the whole shopping center wasn’t more than a few decades old. Rain isn’t nearly as acid as it used to be, but it still eats away at concrete.
After about two decades, though, even high-quality concrete goes bad:
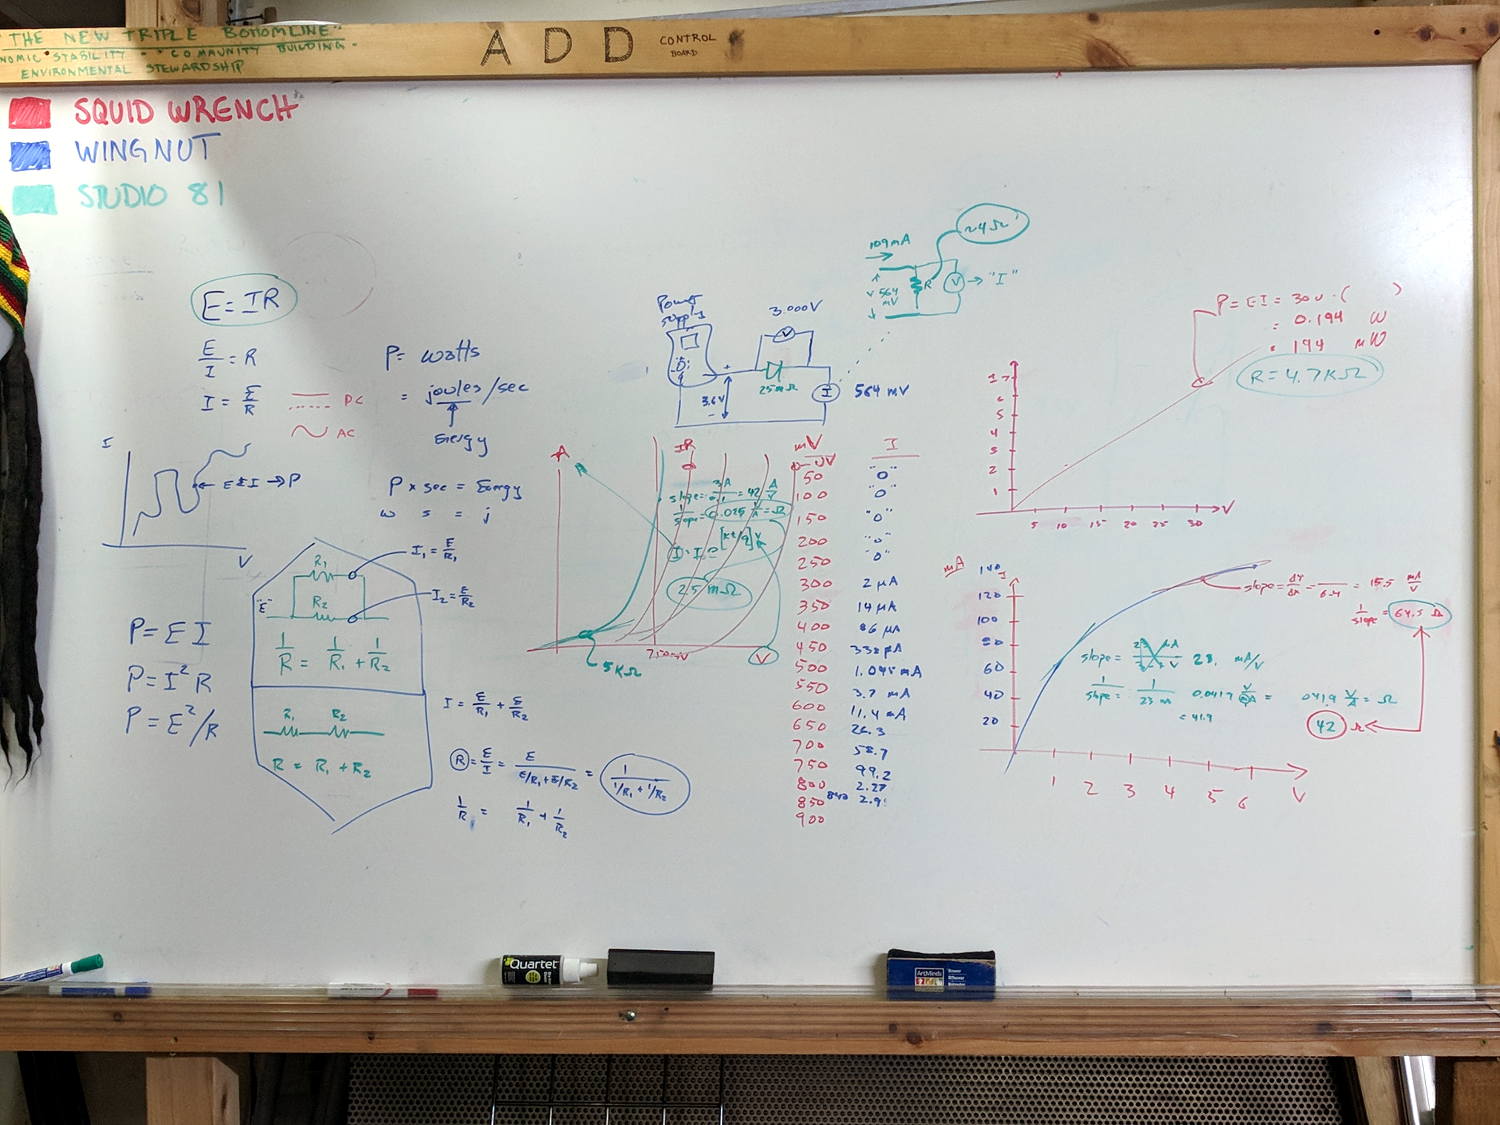
Some ex post facto notes from the second SquidWrench Electronics Workshop. This turned out much more intense than the first session, with plenty of hands-on measurement and extemporized explanations.
Measure voltage across and current through 4.7 kΩ 5 W resistor from 0.5 V to 30 V. Note importance of writing down what you intend to measure, voltage values, units. Plot data, find slope, calculate 1/slope.
Introduce power equation (P = E I) and variations (P = I² R, P = E²/R)
Measure voltage across and current through incandescent bulb (6 V flashlight) at 0.1 through 6 V, note difference between voltage at power supply and voltage across bulb. Plot data, find slopes at 1 V and 5 V, calculate 1/slopes.
Measure voltage across ammeter with bulb at 6 V, compute meter internal resistance, measure meter resistance. Note on ammeter resistance trimming.
Measure voltage across and current through hulking power diode from 50 mV – 850 mV. Note large difference between power supply voltage and diode voltage above 750-ish mV. Note power supply current limit at 3 A. Plot, find slopes at 100 mV and 800 mV, calculate 1/slopes. Compare diode resistance with ammeter resistance.
Some ex post facto notes from the first SquidWrench Electronics Workshop, in the expectation we’ll run the series from the start in a while. I should have taken pictures of my scribbles on the whiteboard.
Define:
Voltage – symbol E (Electromotive Force or some French phrase), unit V = volt
Current – symbol I (French “intensity” or some such), unit A = ampere
Resistance – symbol R (“resistance”), unit Ω (capital Greek Omega) = ohm
Introduce Ohm’s Law & permutations, postpone calculations.
Measure the actual voltage of assorted cells & batteries. Identify chemistry, internal wiring:
1.2 = nickel-cadmium or nickel-metal-hydride
1.5 = carbon-zinc or alkaline
2 V = lead-acid
3.0 = primary lithium
3.6 – 3.7 = rechargeable lithium, several variations
4.8 = 4 x 1.2 V
7.2 = 6 x 1.2 V
7.4 = 2 x 3.6 V
9.6 = 8 x 1.2 V
10.8 = 3 x 3.6 V
12 = 6 x 2 V
Measure various resistors, favoring hulking finger-friendly sandstone blocks.
Introduce metric prefixes:
Engineering notation uses only multiple-of-three exponents
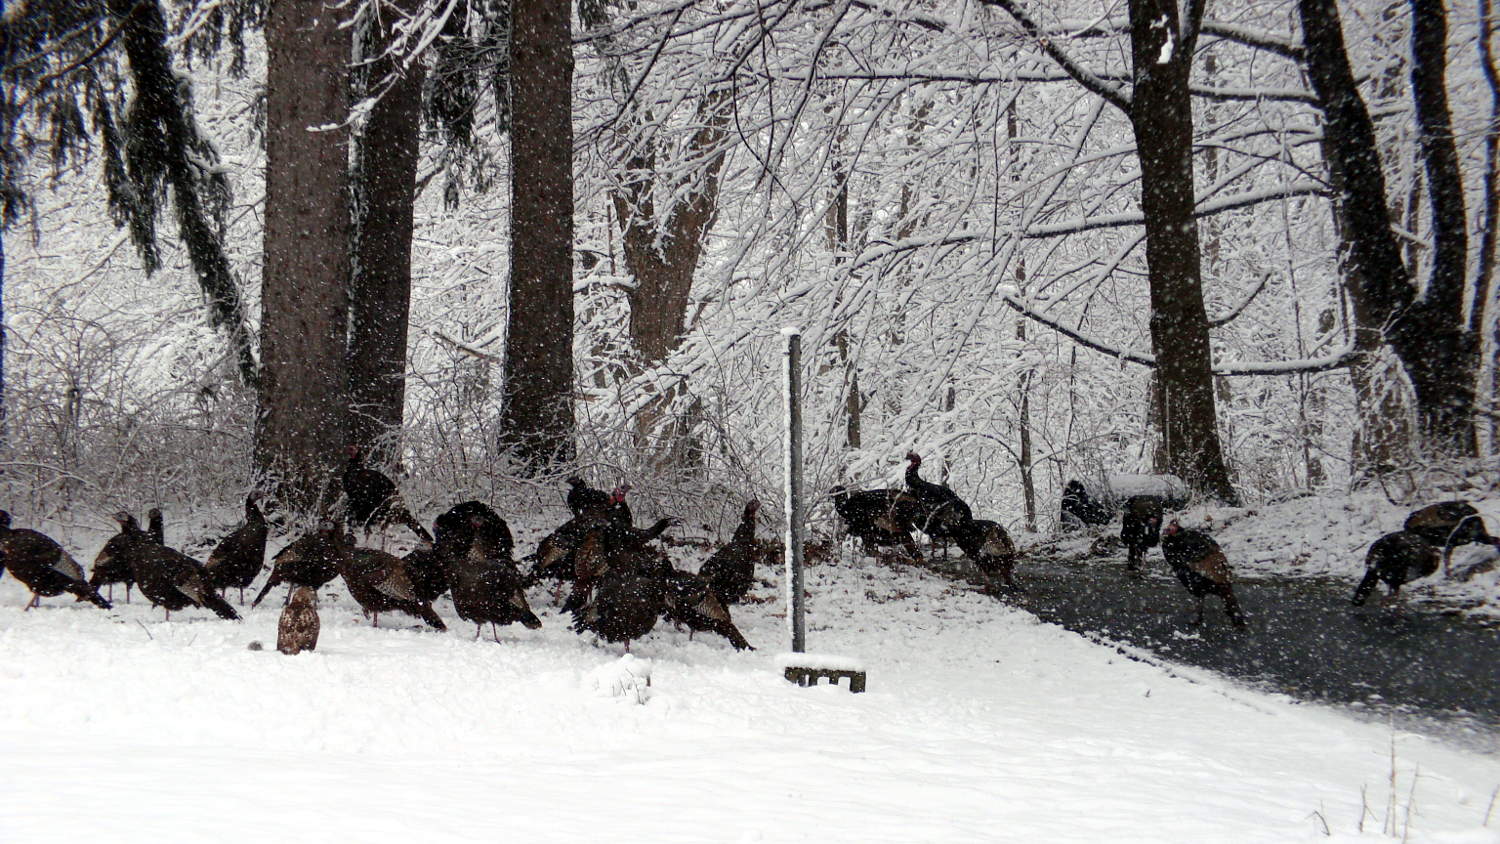
All of the local turkeys come together during snow storms, often lingering in the circle of pine trees in our back yard to get some protection from the wind. Mary spotted a Cooper’s Hawk in the midst of the turkey flock, with its wings spread around a recently captured meal:
Hawk with squirrel – wings spread
When she first saw it, the hawk had its back to us and looked like a cluster of dead pine branches; the recent back-to-back storms have cleared out quite a bit of deadwood.
When I quietly opened the back door for a better view, the hawk noticed and gave me the stinkeye from 100 feet away:
Hawk with squirrel – 2
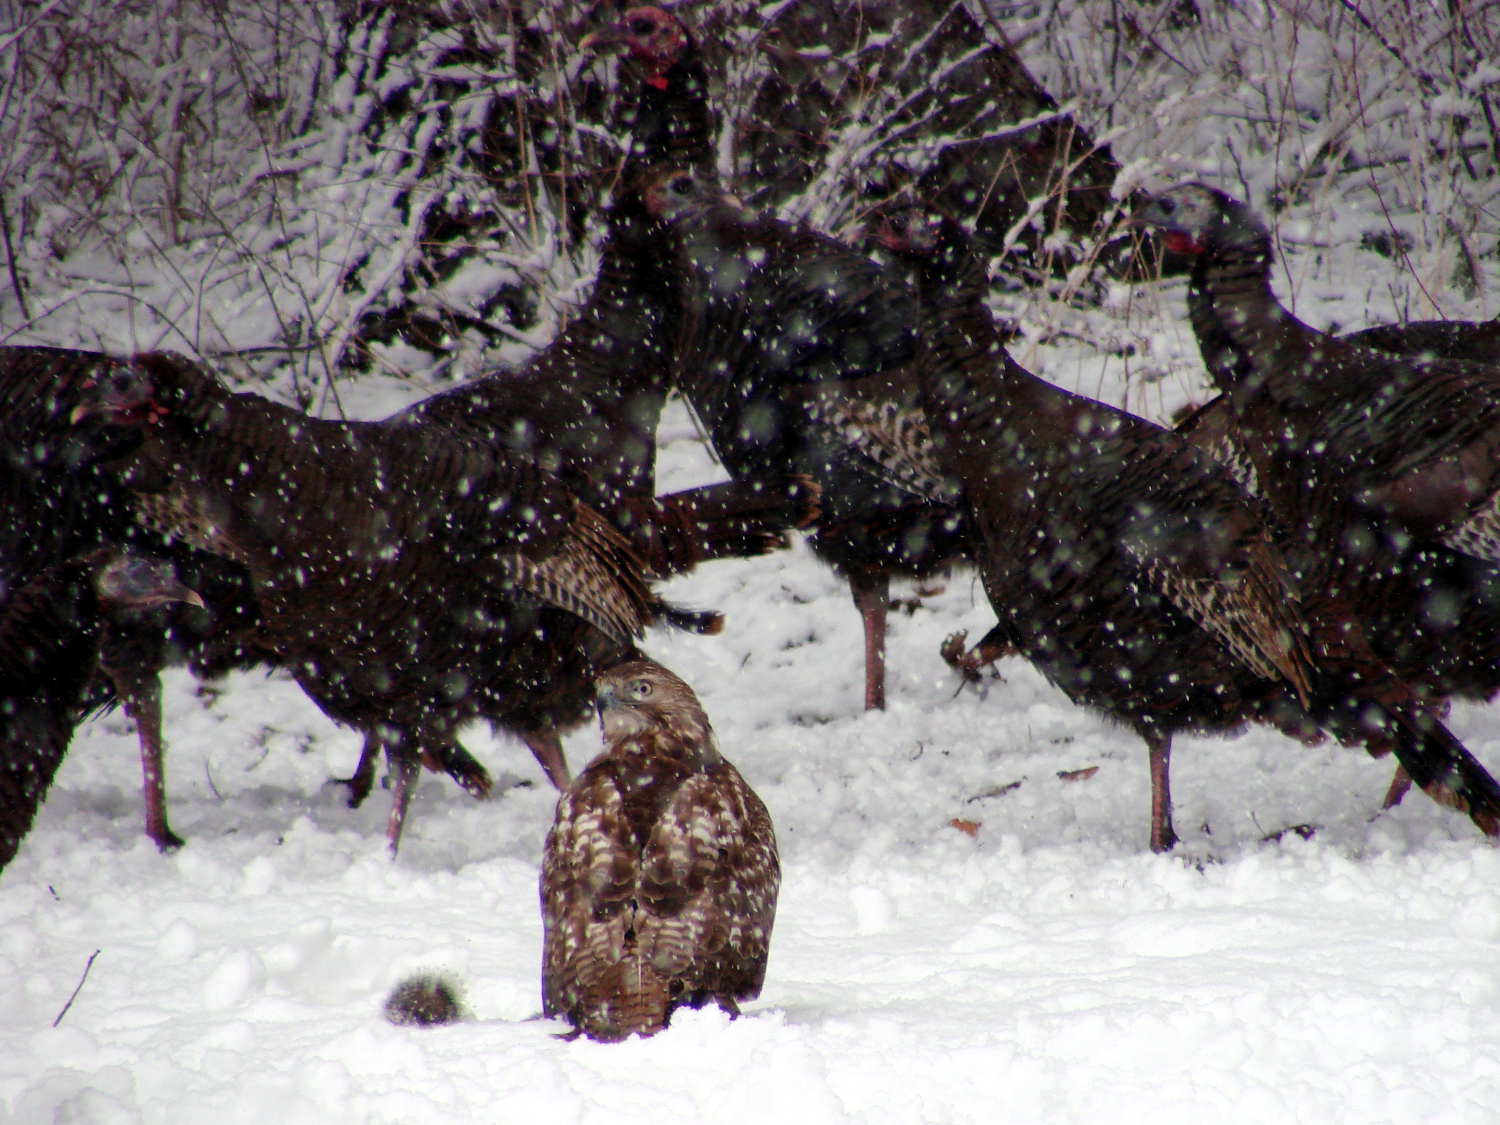
The flock had moved out of the pine circle to surround the hawk and examine the situation, although they weren’t harassing it:
Hawk with squirrel – 3
We’ve counted 27 turkeys, more or less, on some days, well and truly outnumbering the hawk:
Hawk with squirrel – overview
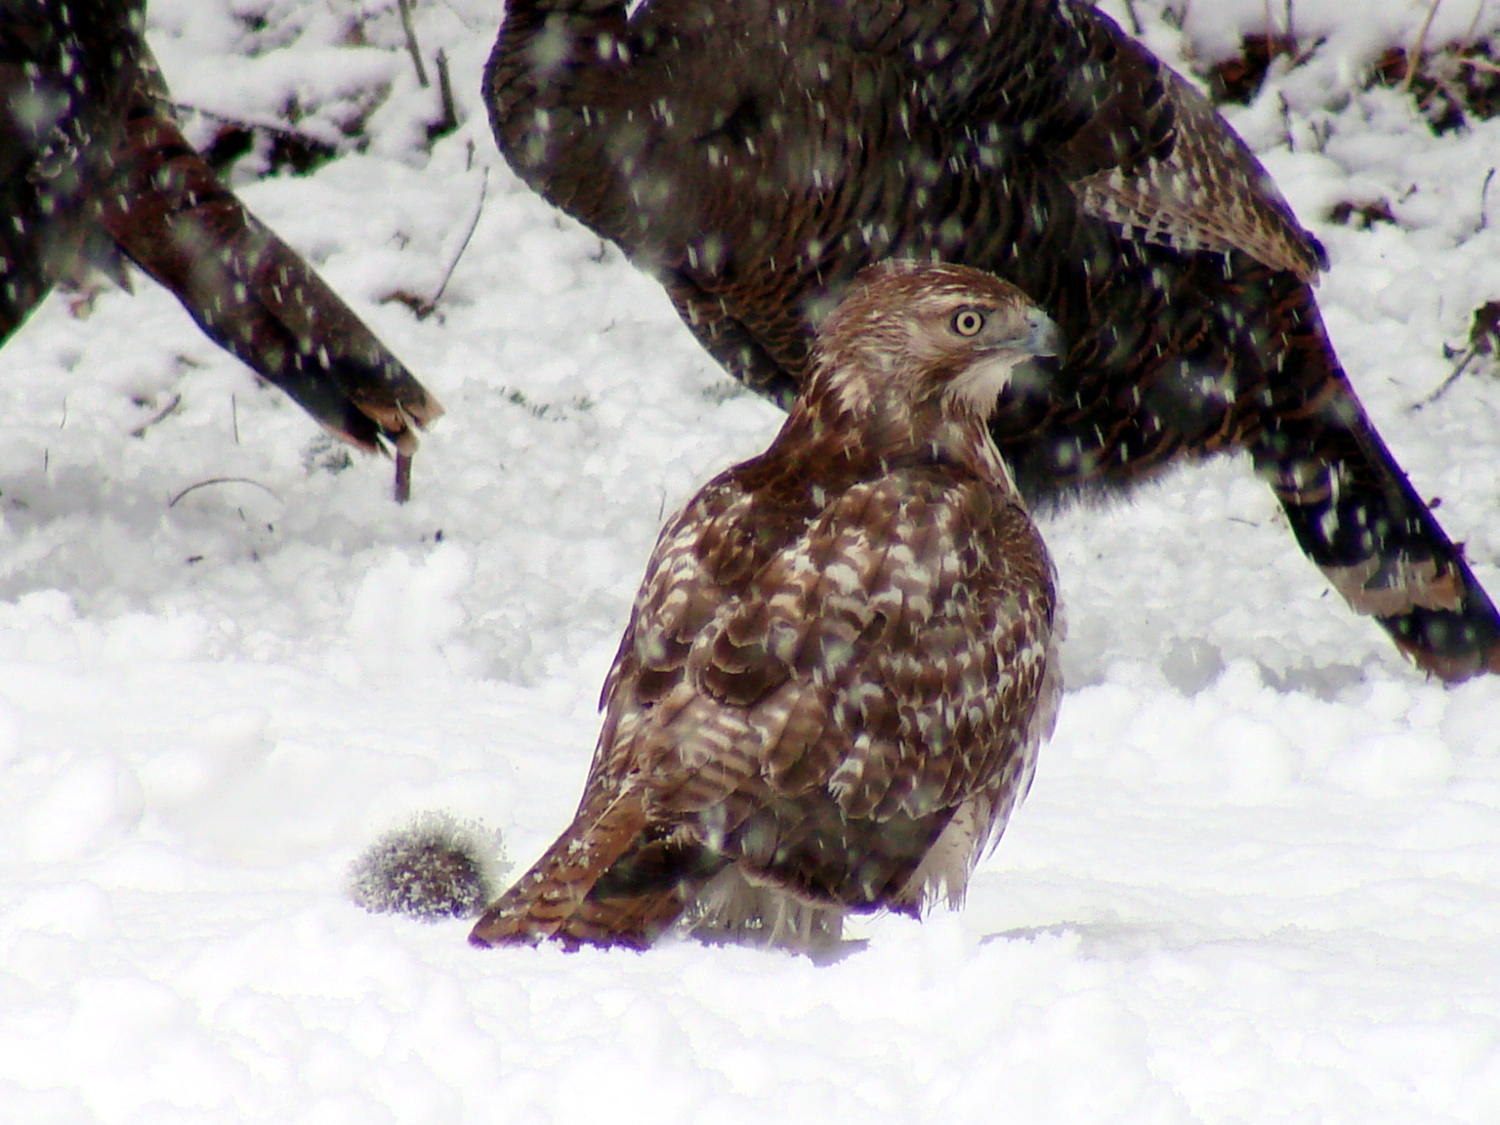
Fortunately, turkeys feed mainly on insects and seeds, rather than tearing into carrion, so they’re not competing for the prize:
Hawk with squirrel – detail
Shortly after I gave up and went back inside, the hawk sank her (?) talons into the squirrel, lifted heavily into the air, circled around the pines, and flew off toward the Mighty Wappinger Creek out back.
A casual search suggests both the hawk and the squirrel weigh about 1 lb = 500 g: I’ll never complain about heavy grocery bags again!
The force increases linearly at 30 g/mm up to the trip point, drops by maybe 16 grams, then increases linearly again.
Obviously, the “constant” applies only to switches on MBI-style endstops in the lot I happen to have, but given the ubiquity of parts from the usual eBay sellers, any identical lever switches may have the same “constant”:
Endstop lever switch – detail
Your mileage will vary, fer shure.
Poking a pen into a similar switch used as a tool setter means the Z-axis coordinate of the trip point will depend on the opposing springs. That’s unlike the situation with a cutter mounted in the DW660 spindle, which (by definition) shouldn’t move in response to the pressure from a little bitty switch.
Eyeballing the graph, the switch travels 2.2 mm to the trip point, where it exerts 64 g of force. The pen holder opposes that force and therefore deflects (64 g) / (100 g/mm) = 0.64 mm just before the switch trips: the trip point will be the same as with a rigid tool, but the tool’s Z axis coordinate will be 0.64 mm lower.
I’d been touching off pens in the springy holder, with enough pressure to draw a decent line. Setting Z=0 with the holder deflected upward by 0.3 mm means the pen first touches the height probe at Z=+0.3 and the switch trips at Z=-0.3 mm (-ish), making the force on the paper 60 g, rather than the 30 g I expected.
I think the pen plots worked out pretty well, despite not getting the numbers and, thus, pen positions, quite right.