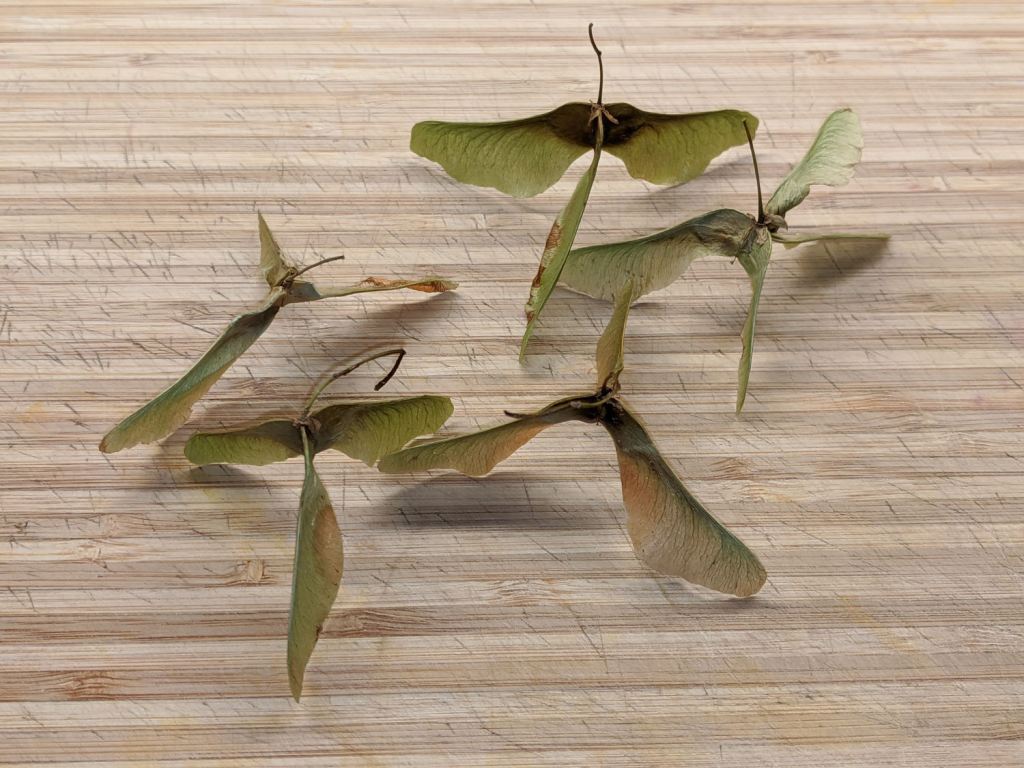
Today I Learned that maple seed spinners are properly called samaras:

The Norway Maple near the road produced a bumper crop of triples this year, along with the first quad spinner samara I’ve ever seen.
Looks like the odds are ever in my favor …
The Smell of Molten Projects in the Morning
Ed Nisley's Blog: Shop notes, electronics, firmware, machinery, 3D printing, laser cuttery, and curiosities. Contents: 100% human thinking, 0% AI slop.
Today I Learned that maple seed spinners are properly called samaras:
The Norway Maple near the road produced a bumper crop of triples this year, along with the first quad spinner samara I’ve ever seen.
Looks like the odds are ever in my favor …

Back in the day, John Forester’s Effective Cycling defined how vehicular bicycling should be done; our now-fragile comb-bound 1980 Third Printing of the 1978 Third Edition still has a place of honor on our bookshelves. I recently discovered his analysis of how traffic signal timing should work online, which says I’ve drawn the wrong conclusions from my observations of the absurdly short green / yellow / red cycle on Burnett Blvd at Rt 55, just in front of NYS DOT’s Region 8 headquarters.
The phasing sequence that is required by current traffic law is as follows:
1. Green, which may be very short when only one vehicle is waiting
2. Yellow, of only sufficient duration to allow a stop from maximum legal speed before entering the intersection
3. Red (a 4-way red), for sufficient additional time for traffic to clear the intersection before the conflicting green appears.
Forester: https://johnforester.com/Articles/Facilities/traffsig.htm
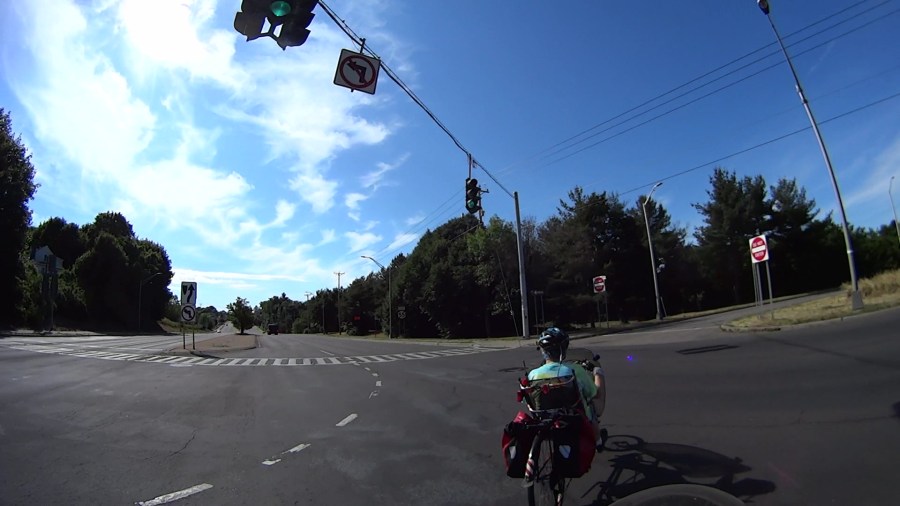
With that in mind, here’s how his analysis stacks up against one of our recent trips through the intersection. The four-digit number in the picture titles gives the time in frames at 60 frame/sec.
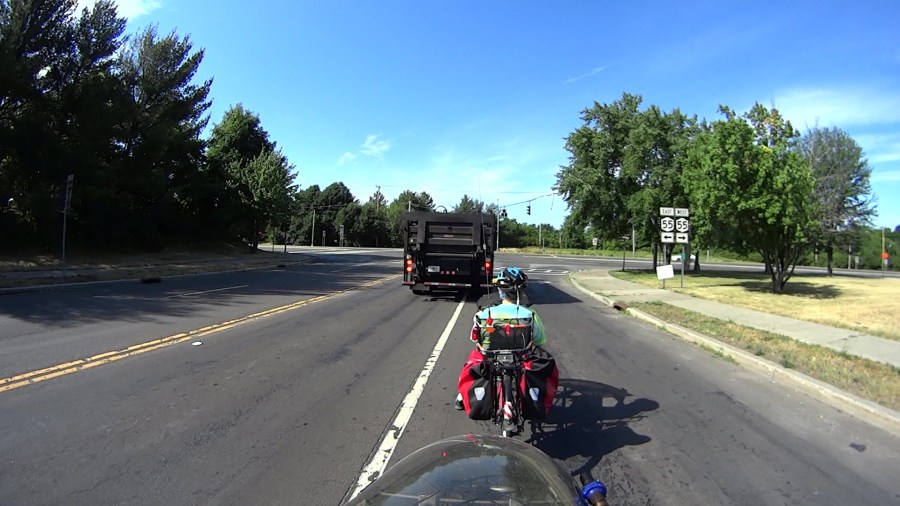
We’re stopped one car length behind a long trailer of paving equipment sporting an Iowa license plate. The driver has stopped with the trailer straddling the lane divider line, so we cannot determine which way he will turn. Because we no longer trust turn signals, despite the trailer’s blinking left signal, we will not pull up beside it in the right lane.
Frame 0127, T = 0 s, Δt = 0 s: The signal has just turned green:
Frame 0264, T = 2.28 s, Δt = 2.28 s: The trailer has started moving and Mary is rolling behind it, with her foot just coming off the ground:
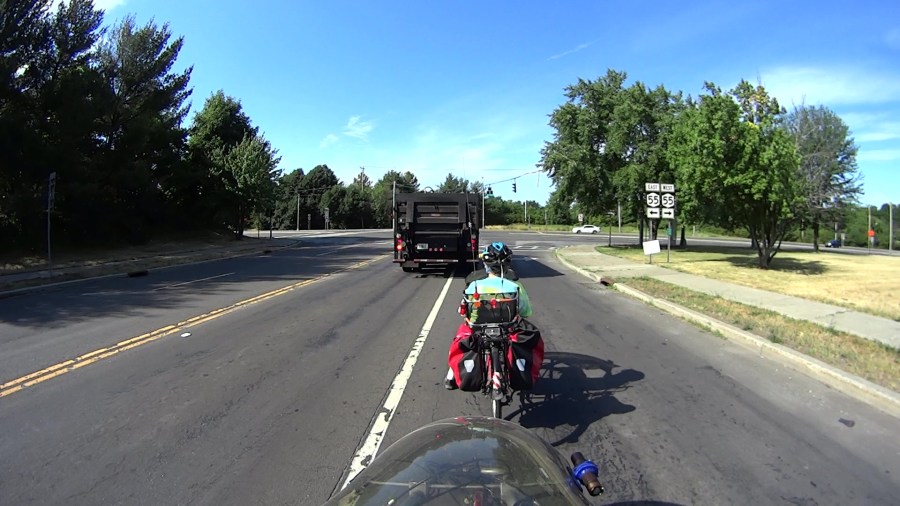
Frame 0721, T = 9.9 s, Δt = 7.6 s: The signal turns yellow, after DOT’s additional five seconds of green; previously, we had five seconds and would have been able to stop. We’re accelerating as hard as we can, but Mary has barely passed the stop line:

Of course, entering an intersection on a stale yellow is undoubtedly unwise. It is not so unwise for someone traveling fast, because that person may well clear the intersection before the conflicting traffic starts. It is much more unwise for someone traveling slowly, but it is done and it is lawful.
Forester, ibid.
We’ve traveled about three car lengths in the seven seconds since the trailer started moving. Our bikes will sometimes trigger the signal if we’ve stopped in exactly the right spot over the unmarked sensor loops, but we have never observed our bikes retriggering the signal to lengthen the green or yellow phases as we ride through the intersection.
NYS DOT apparently expects us to stop abruptly when the signal goes yellow, wherever we may be with respect to the stop line and regardless of how fast we may be moving. In fact, given what you’re about to see, we’re expected stop on green to ensure we can start from the stop line during the next green signal.
Frame 0983, T = 14.2 s, Δt = 4.4 s: The signal turns red. The trailer is visible on the left, beyond the median signage, but we haven’t reached the middle of the intersection. I’m lined up with the rightmost lane of westbound Rt 55 and Mary is about in the center lane. The white car on our right is stopped, the black car is slowing to a stop:

Frame 1101, T = 16.2 s, Δt = 2.0 s: The opposing signal goes green for Rt 55 traffic, while we’ve barely reached the middle of the intersection:
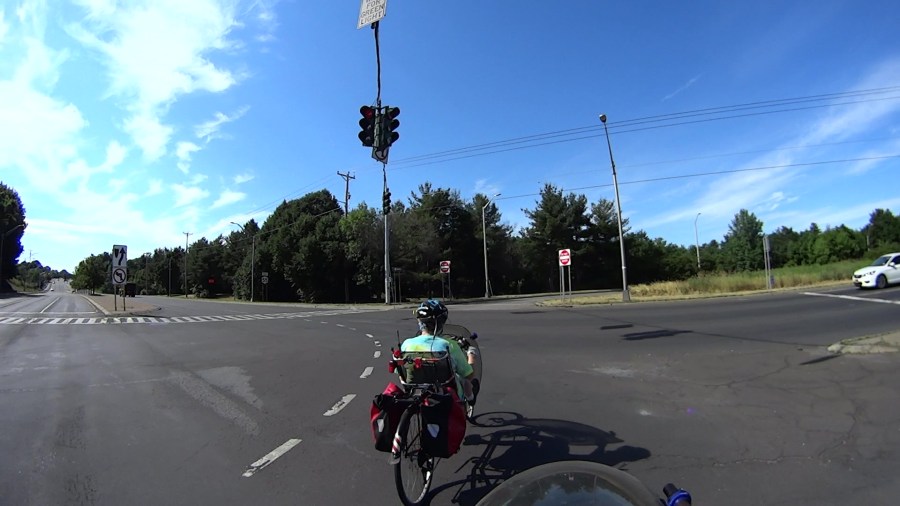
Frame 1205, T = 18.0 s, Δt = 1.8 s: I’m lined up with the median, Mary’s in the center lane of eastbound Rt 55, putting us squarely in front of drivers who may be unable to see us through the stopped cars. The drivers to our left are, fortunately, waiting, unlike a previous crossing:
Frame 1440, T = 21.9 s, Δt = 5.7 s: After 22 seconds, we’ve cleared the intersection and are proceeding eastbound on Rt 55:

Forester observes the all-red phase must be lengthened to allow cyclists to clear the intersection. Right now, two seconds isn’t enough. Ten seconds would suffice for a pair of reasonably fit, albeit aging, cyclists.
This system fails to provide the required safety in the case of bicycles for three opposite reasons.
1. Bicycles are small and are harder to see. In particular, the most visually impressive part of the bicycle and rider is low down where it is easily shielded from view by the hoods of motor vehicles. Sometimes the only part of the cyclist that can be seen by drivers waiting at the stop line with other vehicles on their left is the head of the cyclist.
2. The cyclist crossing a typical intersection is close to the fronts of the line of cars waiting at the stop line on the cyclist’s right. This is not good judgement on the part of the cyclist, but so much emphasis has been put on staying far right that this position is typical.
3. The cyclist who is traveling slowly, or, more importantly, is starting from a minimum-duration green, is barely into a wide intersection when the conflicting green appears.
The result is a car-bike collision as one of the vehicles in the lanes nearest the curb starts up, or speeds up, and hits the cyclist who suddenly appears in front of it.
Forester, ibid.
I’ve had a DOT engineer tell me, sneeringly, that they don’t design facilities for “professional cyclists”, which commuting to work evidently made me; he was not, however, a “professional driver” even though he used a car for a similar purpose. It’s obvious DOT doesn’t design facilities for “ordinary” cyclists, either, and the evidence suggests they don’t design facilities for cyclists, period, full stop.
I still want someone from NYS DOT to explain how this “makes our highway systems safe and functional for all users“, perhaps by bicycling with us through the intersection a few times, but I’ve never gotten a response, let alone an answer, to anything I’ve ever sent their way.
For comparison with the Anonymous White Charger of Doom, I bought a trio of Abosi USB chargers:
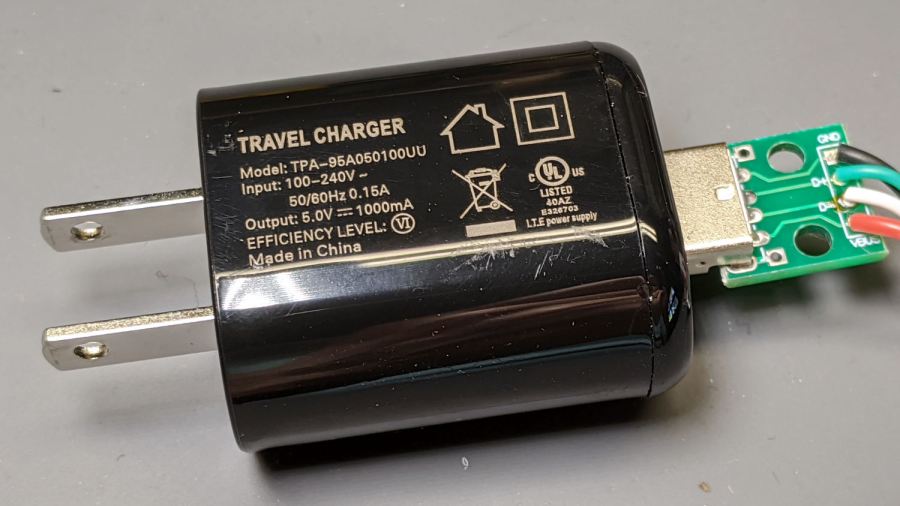
The symbology indicates it’s UL, but not CE, listed. Consumer Reports has a guide to some of the symbols; I can’t find anything more comprehensive.
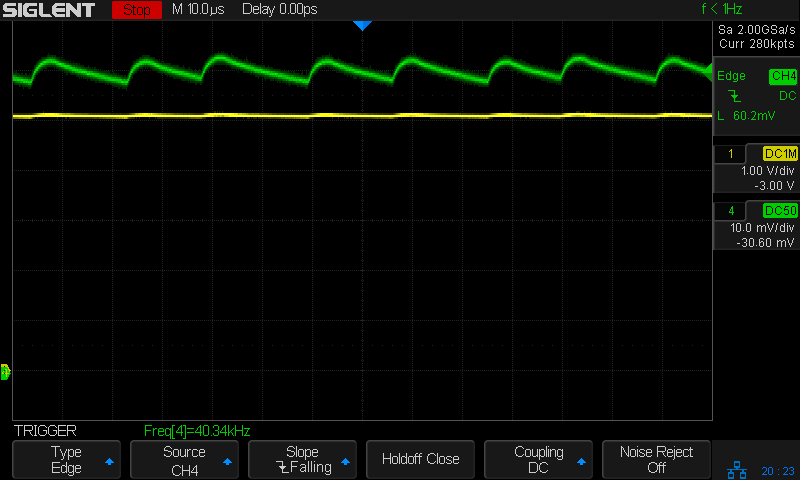
Applying the same 8 Ω + 100 µF load as before:

The voltage (yellow) and current (green, 100 mA/div) waveforms look downright tame compared to some of the other chargers!
I made a cursory attempt to crack the case open, but gave up before doing any permanent damage. Hey, that UL listing (and, presumably, the interior details) means they’re three times the price of those Anonymous chargers!

In round numbers, a nasty COVID-19 infection ramps up for a week before you develop enough symptoms to finally get tested. Various states report various combinations of test results as confirmed / probable / tested “cases”, with “tested” including any possible combination (or lack thereof) of viral / antibody presence. As a result, the number of “daily cases” doesn’t mean much, but it’s the only number we’re likely to get. With that in mind, about 6% of those tested have a positive result for whatever they’re being tested for. Got that?
At some point within a week or two of being infected, tested, and found positive, about 2.8% of all cases will be hospitalized. That’s 2.4% of cases in the 18-49 age bracket and 4.3% of my decade (64-75):

You get the Weekly Rate chart from the CDC’s weekly data by drilling into the Hospitalization block to reach the summary chart (through Additional Rate Data), dinking with the controls to show the Weekly Rate and COVID-NET Surveillance Area, then turning off the overlapping age ranges. Most of us seem to have an Underlying Medical Condition or two affecting the outcome.
Roughly a week (more or less, kinda-sorta) after hospitalization, 15% of all patients and 28% of those over 65 will die:

You get that chart from the Lab-Confirmed Hospitalizations page by dinking around with the controls for the lower-right pane. The Overall column represent 5800 patients and, as it happens, each column represents about 2000 patients.
Because it takes about three weeks to go from “infected” to “dead”, the ratio of [daily deaths today] to [daily positive test results from three weeks earlier] gives (In My Opinion) a better indication of the expected outcome than the simpler ratio of [today’s deaths] to [today’s test positives]. Because the news headlines always feature cumulative numbers, these numbers aren’t at the tip of anyone’s awareness.
Fetch the daily data as a CSV from the COVID Tracking Project’s Historical Data, compute the day-to-day values from the appropriate columns, then slam the columns into a graph:

The strong weekly component is surely a combination of data aggregation (no weekend reports?) and actual death events (nobody dies on Sunday?), but there’s no way to know from here. There’s plenty of noise in April which I decided to completely ignore; consult the raw data and draw your own conclusion.
Eyeballometrically, the lagged CFR has been declining linearly by 1% every 3 weeks since mid-May and should be around 2% in July. If you’re under 50 and in reasonable health, the news is even better, because you’re very unlikely to either need hospitalization or die from it. Again, work the numbers out for yourself from the raw data.
However, AFAICT, those results depend on a relatively unloaded healthcare system, because little of the US has (yet) to experience the catastrophic overload seen during the early onset in Washington state and NYC. This chart of ICU occupancy suggests the worst is yet to come for folks in states where expectations don’t match up to the reality of exponential growth:

It seems having the ICUs tick along at 50% occupancy is about right, so the states with 70+% occupancy don’t have much surge margin.
Right now, COVID-19 is burning through the US population at about 30,000 confirmed new cases per day, which means 840 people will require hospitalization every day next week (in addition to all the usual hospitalizations for other causes) and, in another week, 126 people will die every day. Maybe 40 people under age 50 will die, so the human herd will develop immunity by killing off we Olde Fartes.
After I ran those numbers, the rate passed 40,000 cases per day, with no sign of slowing down and indications it’s getting worse faster. Scale my numbers up by 30%: 1100 hospitalizations and 170 deaths per day in a few weeks.
However, if you live in one of those dark purple states already showing 70+% ICU utilization, don’t do anything starting with “Hold my beer. Watch this!” because you will not get a welcoming Emergency Room reception. The CNN synoptic view of new cases continues to be informative.
One of Mary’s cronies is married to a guy who knows this whole COVID-19 thing is a hoax: “They’d all have died of something else, anyway.” Plotting all-cause fatalities vs. age (2020 in red, last five years in gray) shows tens of thousands of people are dying from something new this year:
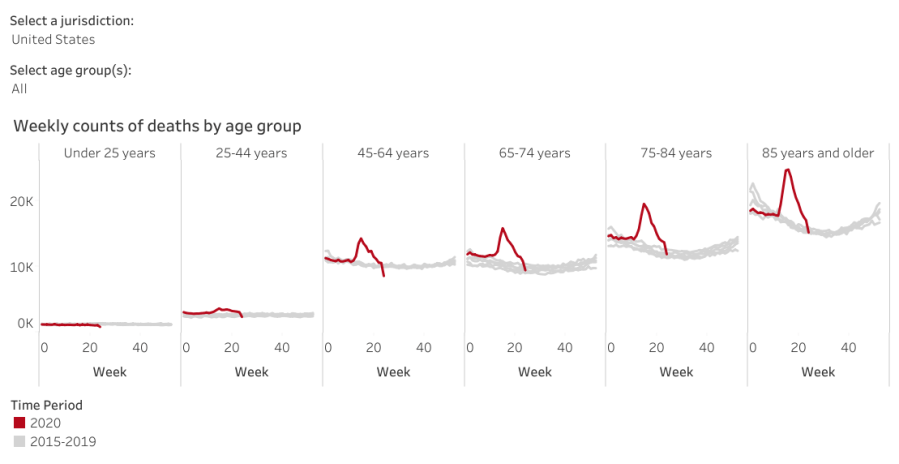
Before you do the happy dance about the downward slope toward the right, read the disclaimer:
Data are incomplete because of the lag in time between when the death occurred and when the death certificate is completed, submitted to NCHS and processed for reporting purposes. This delay can range from 1 week to 8 weeks or more, depending on the jurisdiction and cause of death.
Some of the decline is real, because NYC hospitals aren’t running out of body bags nowadays, but much of it seems due to the paperwork not catching up with reality.
Judging from the slope of the Johns Hopkins summary of daily cases in the US, corroborated by the CNN projections, the doubling time (before the most recent increases) runs around four weeks: five million cases by the end of July and ten million by the end of August. Later this year, we’ll know how well saying “It’ll be gone by April summer Election Day 2021″ without doing anything has worked out for us.
The overall death rate should decline in a few years, because those (of us?) who died early will reduce the later rate, but it’s not something to look forward to.
Back to the Basement Laboratory … and, on good days, the rail trail.
Dutchess County has another Household Hazmat / Electronics Disposal Day coming up, so I harvested some useful parts from the three dead dehumidifiers lurking under the bench.
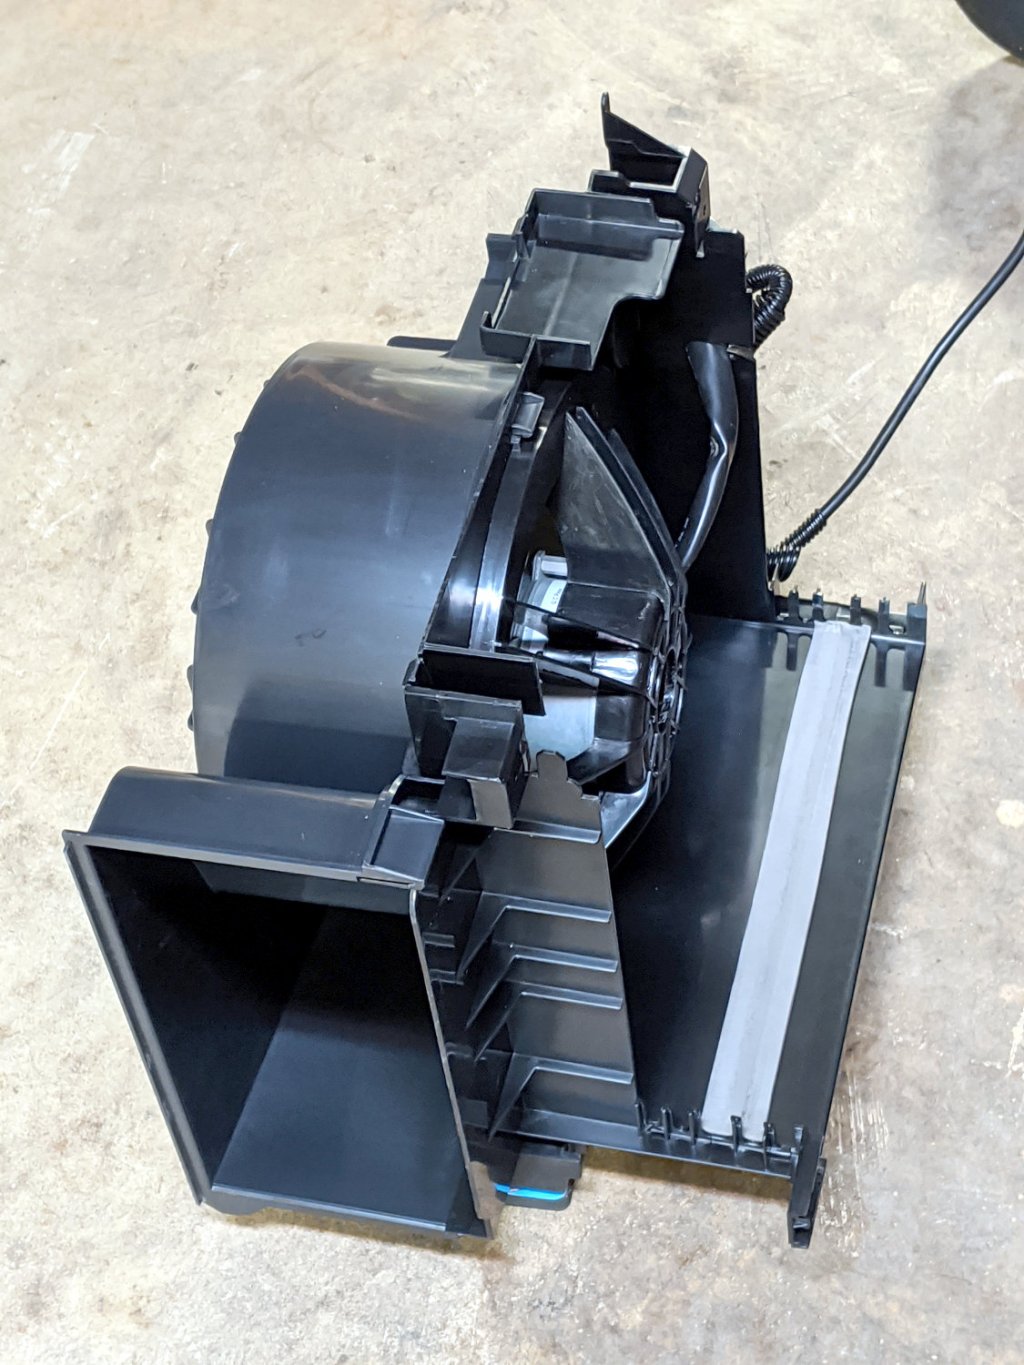
The (perfectly good) blower motor in one unit lives inside a convenient plastic housing:

It’s sitting on three foam pads hot-melt glued to three wood blocks cut to fit inside three convenient molded features, making it nice & quiet & stable.
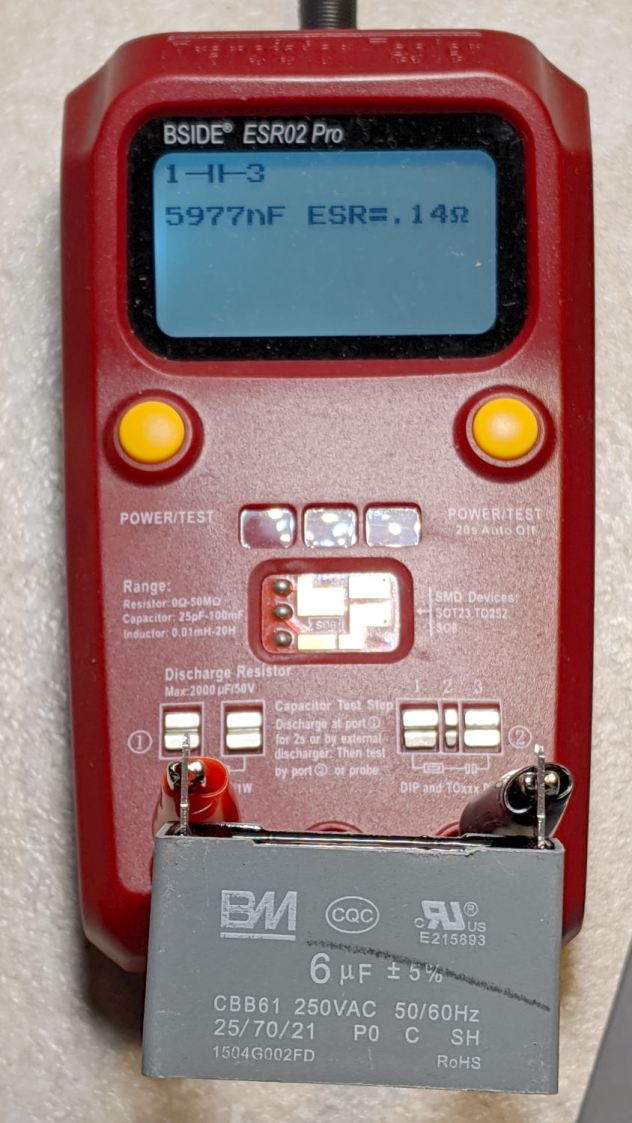
The motor uses a nice polypropylene run capacitor:

Which is also perfectly good:
The motor includes a wiring diagram:

I lashed it together with a chopped-off IEC cord, because the stock dehumidifier cords are just way too stiff. The motor and blower originally pulled air through the dust filter, the condenser, and the evaporator, before blowing it out the side, so it’s running pretty much unloaded. A quick test shows there’s not much difference between the high and low speeds:
Low speed seems slightly less noisy, but the wiring now has insulated QD connectors just in case I ever want to run it at full speed.
For whatever it’s worth, the most recent dehumidifier failed one year into a two year warranty, but the company decided it was simpler to just refund the purchase price than to replace the unit. It seems the “sealed system” inside loses its refrigerant after a year and there’s no practical way to seal a small leak and recharge the system; unlike an automotive air conditioner, the tubes are soldered shut after the initial charge.
They all sport Energy Star badges, but throwing away the whole damned thing every year or two tells me we’re not measuring the right values. Obviously, somebody could make a worthwhile dehumidifier, but as of now Frigidare, GE Appliances (sold to Haier), and Danby are on my shit list. Next year, I expect to add HomeLabs to the list, because the dehumidifier is identical to the Danby unit (and, ah-ha comes with a 2.5 year warranty). They’re all made by Haier (or another Chinese factory) and nobody applies any long-term QC to their products.

The SJCAM M20 action camera has been attached to the back of my Tour Easy for the last 16 months:
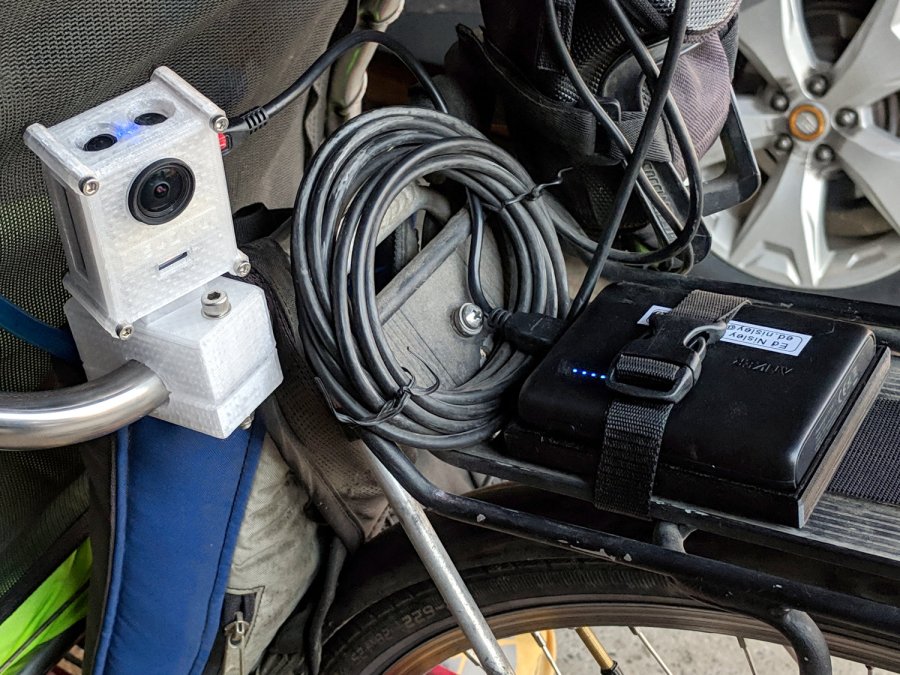
The Anker 13 A·h USB power pack on the rack provides juice for a week’s worth of rides, letting the M20’s internal battery keep its clock & settings alive between rides. I recently forgot to turn on the USB pack and discovered the camera shut down just after I cleared the end of the driveway.
As you should expect, the battery had swollen so much its pull tab … pulled off … when I tried to extract it:
So, we begin.
Pry off the trim ring around the lens by jamming a small screwdriver in any of the three slots:
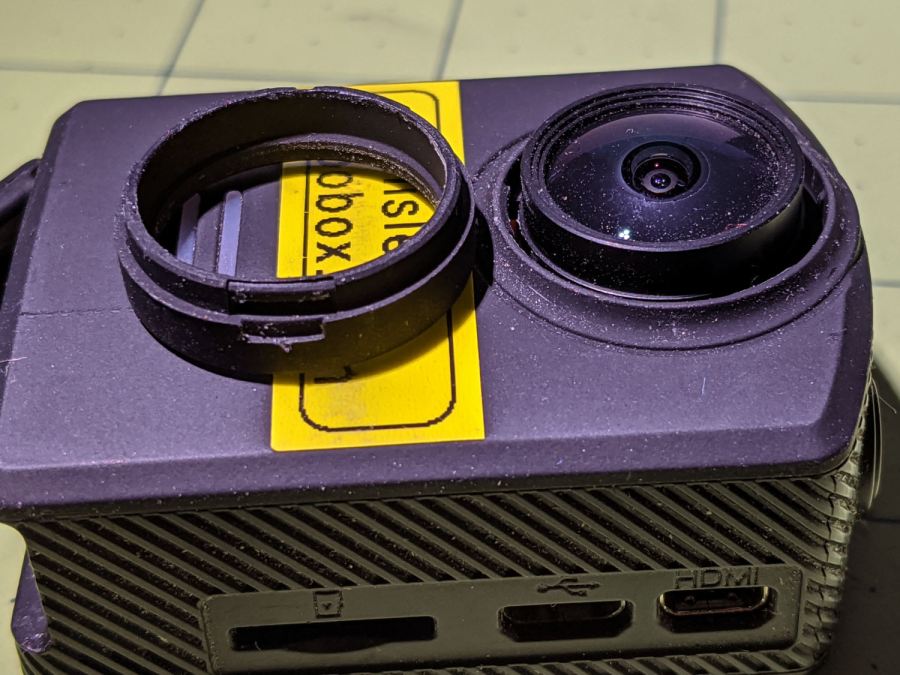
Then pry off the entire front panel:

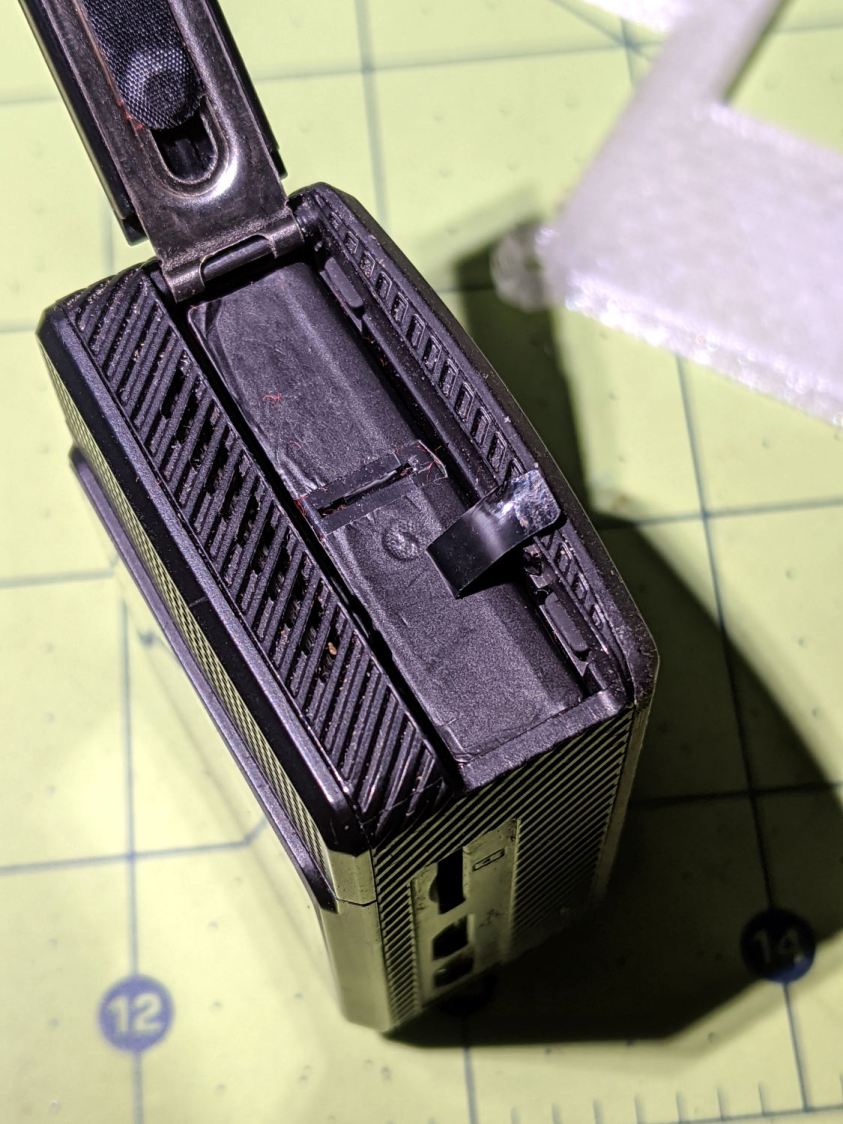
Thereby exposing the battery’s rectangular protrusion and three contacts next to the optical block:

Avoid shorting the brass terminals with, say, a small screwdriver, while shoving the battery out of the camera until you can grab it with your fingers and haul it out the rest of the way:

Yeah, that puppy looks all swoll up:

Remove the all-enclosing label to reveal the bag inside:
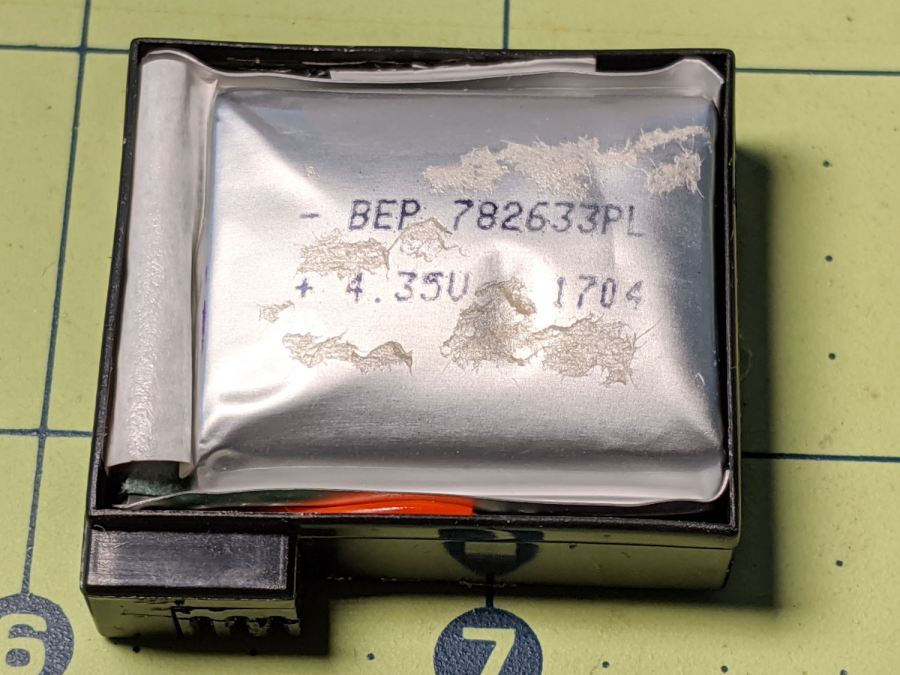
Pull the bag out to reveal the protection PCB:

Snip the wires and salvage the case against future need.
I bought the camera with three batteries, all three of which are now similarly swollen. I also got two official SJAM batteries with an official SJAM charger; both of those batteries seem to be in fine shape. I expect the codes on the five bags would reveal two different lots, but I’m not going to sacrifice a nominally good battery to find out.
All three swollen battery bags show the same BEP 782633PL lot code and 1704 date code. I bought everything in January 2018, so those batteries had been sitting on the shelf for the better part of a year. Maybe that’s why they offered a “deal” for two spare batteries along with the camera?
Installing one of the unswollen batteries, reconfiguring the camera’s settings & clock, and giving it a charge from the Anker USB pack put it back in operation.
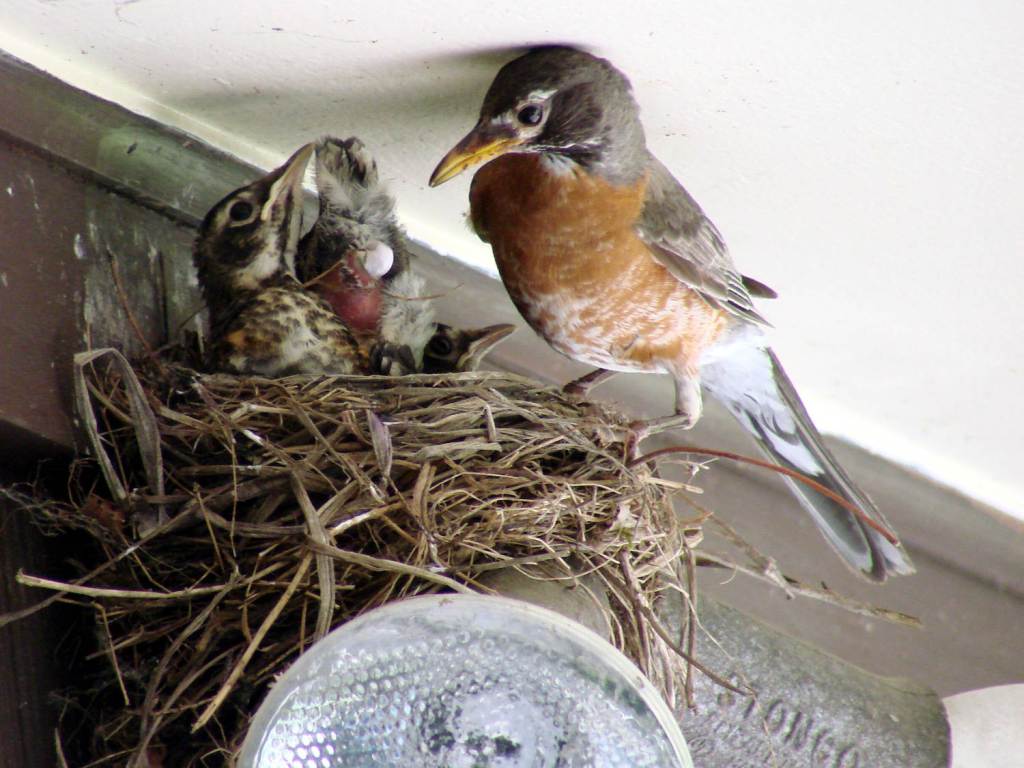
The robin nestlings fledged fourteen days after we spotted the first eggshell on the driveway below the nest. The first one may have flown away the previous evening, leaving three increasingly restless siblings behind:

They’re recognizably robins now, covered in young-bird speckle camouflage.
Feeding continued apace:
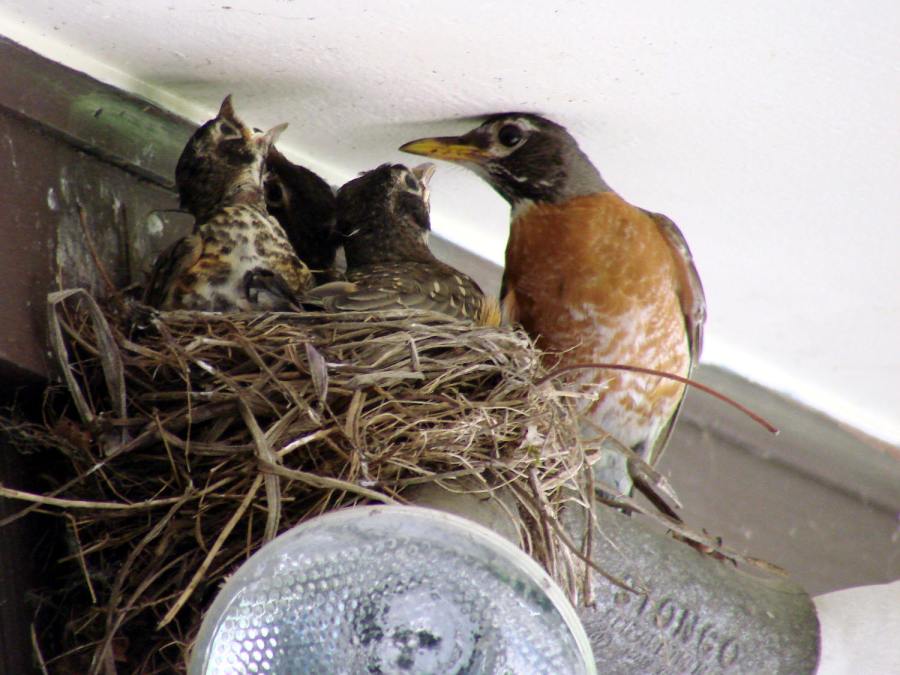
After feeding, robin nestlings produce fecal sacs, which the parents either eat or carry away:

Robins aren’t big on facial expressions, but, speaking from personal experience, anything to do with diapers isn’t the high point of a parent’s day.
And then there were none:
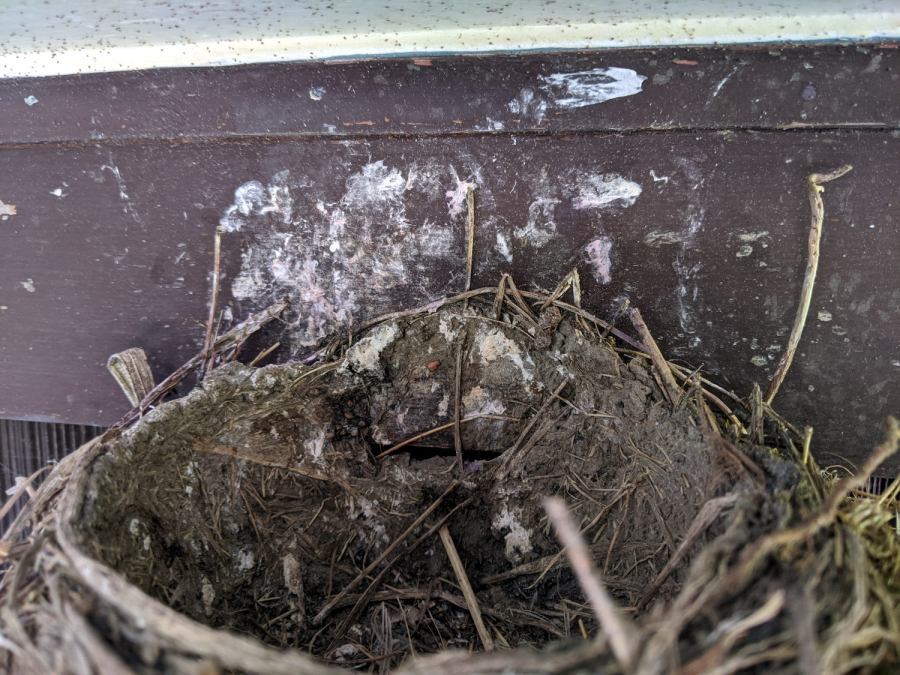
The gazillion black dots on the soffit are pinpoint-sized insects / mites / ticks infesting the nest and, presumably, the birds. The earlier pictures don’t show them, so perhaps these missed the last bird off the nest and are now regretting their life choices.
Go, birds, … gone!
