Ed Nisley's Blog: Shop notes, electronics, firmware, machinery, 3D printing, laser cuttery, and curiosities. Contents: 100% human thinking, 0% AI slop.
Category: Software
General-purpose computers doing something specific
It turns out that if you put convenient symlinks in your directories, then use them to build a LibreOffice document, LO will cheerfully put those paths into the graphic file links inside its XML files. That will produce horrible breakage on a new system without those links. We’ve come to the conclusion that the only way to keep LO happy is to create a Pictures directory in whatever directory holds the document file, then put all of the document’s image files into that directory, and make sure LO stores relative paths. Of course, this leaves us with the prospect of updating a whole bunch of existing (and, alas, horribly broken) documents by hand, which is unappealing. My previous solution worked for a single file, but now it’s time for some scripting…
This would probably be easier in Python, but Bash works fine after you get the quoting straightened out. This script builds several other scripts that actually do the heavy lifting, because that way you can inspect the scripts before running them to verify that you’re not about to make a bad situation much, much worse. I recommend copying the presentations into another directory, running this script, check the output scripts, run them by hand, and then copy the fixed files and the Pictures directory back where they belong.
You must tweak the actual paths to the pictures to match your situation; for these documents, one simple change sufficed for all the image files. Those paths are not variables, because I can barely keep the quoting straight without adding another layer of indirection. Make sure all the paths match up, verify the scripts before you run them, and don’t trust anything you see.
CAUTION: It’s highly likely that the multiple levels of character escaping required to make these listings appear correctly on the screen will produce incorrect results when copied-and-pasted. You can download the script file as FixGraphics.sh.odt, which is a bare-ASCII TXT file (which you must rename to eliminate the ODT extension, then make executable as a shell script), to see how it compares.
The main FixGraphics.sh script, with some key lines highlighted:
#!/bin/bash
echo "Extract list of images from all ODP files"
rm images.txt
for f in *odp
do
unzip -p "$f" content.xml | sed 's/></>\n</g' | grep Cameras | cut -d \" -f 2 | sort -u >> images.txt
done
echo "Make source file name list"
# strip off leading relative pathing, set actual absolute path, un-quote blanks and special characters, add quotes
sed 's/..\/..\/..\/../\/mnt/' images.txt | sed 's/%20/ /g' | sed 's/&/\&/g' | sed 's/^.*/\"&\"/' > source.lst
echo "Make target file name list"
# set relative to current directory
sed 's/\/mnt\/bulkdata\/Cameras\/MCWN/\.\/Pictures/' source.lst > target.lst
echo "Make target directory list"
# must add trailing quote stripped by dirname
rm dirs.lst
cat target.lst | while read tline ; do
tdir=`dirname "$tline"`
echo ${tdir}\"
done > dirs.lst
echo "Create target directory structure script"
rm mkdirs.sh
sort -u dirs.lst | while read dline ; do
echo mkdir --parents ${dline}
done > mkdirs.sh
chmod u+x mkdirs.sh
echo "Create image file copy script"
rm cpjpgs.sh
cat dirs.lst | while read dline ; do
echo cp -n -t ${dline}
done > cptemp.txt
paste cptemp.txt source.lst > cpjpgs.sh
chmod u+x cpjpgs.sh
echo "Create ODP fixup script"
echo "for f in *odp ; do" > fixodp.sh
echo "unzip -p \"\$f\" content.xml > raw.xml" >> fixodp.sh
echo "sed 's/..\/..\/..\/..\/bulkdata\/Cameras\/MCWN/\.\.\/Pictures/g' raw.xml > content.xml" >> fixodp.sh
echo "zip \"\$f\" content.xml" >> fixodp.sh
echo "done" >> fixodp.sh
echo "rm raw.xml content.xml" >> fixodp.sh
chmod u+x fixodp.sh
Run mkdirs.sh, cpjpgs.sh, and fixodp.sh: then it Just Works.
Some of the tricky parts:
The content.xml file may be stored in unformatted mode, with everything mushed together into one huge line. To make it readable and parse-able, insert a newline between each pair of adjoining angle brackets:
sed 's/></>\n</g'
This burst of line noise un-escapes the file name from the way LO stores it internally. Note that the middle sed command really does have the literal escape sequence ampersand-amp-semicolon in it and the ampersand in the last one is the sed-ism for “the whole matching string”:
sed 's/%20/ /g' | sed 's/&/\&/g' | sed 's/^.*/\"&\"/'
The difference between these two sed strings indicates the actual relative path to the Pictures subdirectory in the filesystem and the faked relative path from the LO pseudo-subdirectory where the document stores its internal state. The string of periods in the second command shows what LO stored for the original files in our documents; your mileage will certainly differ:
sed 's/\/mnt\/bulkdata\/Cameras\/MCWN/\.\/Pictures/' source.lst > target.lst
sed 's/..\/..\/..\/..\/bulkdata\/Cameras\/MCWN/\.\.\/Pictures/' raw.xml > content.xml
I don’t know how they could make the file linkages work better, but it’d be really nice if there were a less horrible way to fix the breakage.
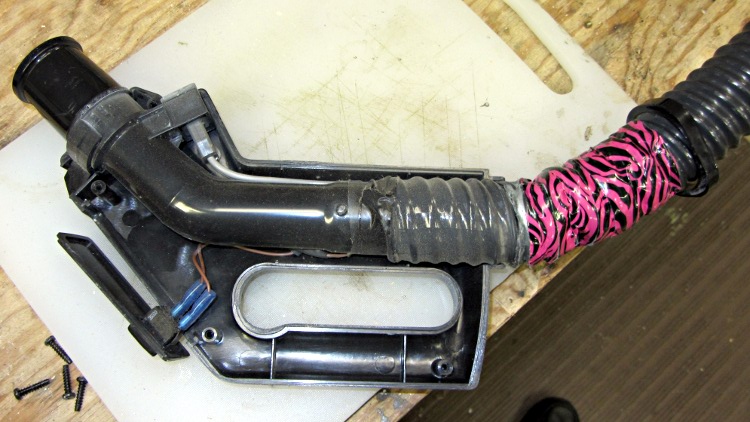
The hose going into the handle of the never–sufficently-to-be-damned Samsung VAC-9048R suck dog has been collapsing for quite some time, but I couldn’t figure out how to take the handle apart. Recently, the lock ring that I would have sworn was glued in place came loose, revealing the secret:
Samsung vacuum cleaner – handle lock ring
You slide four lugs on the lock ring into the open slots, then turn the ring clockwise to force the lugs over barriers into recesses that capture them and hold the lock ring against the handle. The handle under the lock ring isn’t quite circular, nor is the lock ring, and I think (based on later events) that they expect the ring to deform as it turns in order to let the lugs spring over the barriers.
Anyhow, with the lock ring loose, removing four screws released the two halves of the handle:
Samsung vacuum cleaner – handle interior
The handle includes a switch for the powered floor brush, which we rarely use, and a suction control lever that’s basically a binary leak: on or off. With the handle opened in front of you, remove the innards, unwrap the decorative duct tape, unwind enough of the two power conductor / spring wire ribs to allow for rebuilding the electrical connections, and cut off the damaged part of the hose.
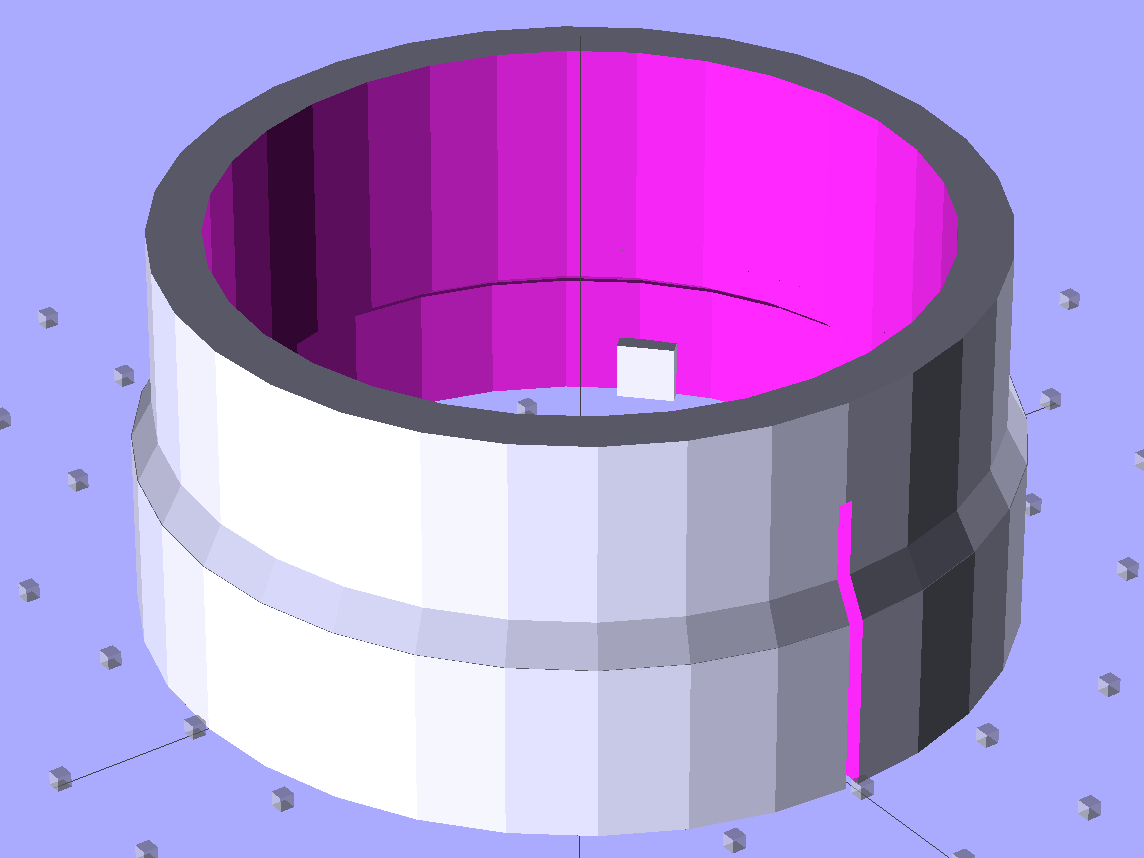
Now, obviously, what that hose needs is a little bit of strain relief, along the lines of the hideous snout I’d affixed to its other end a while ago. The general idea is to replace the lock ring with a little attachment that will hold the heatshrink tubing in place. Something like this:
Bushing Solid Model – top
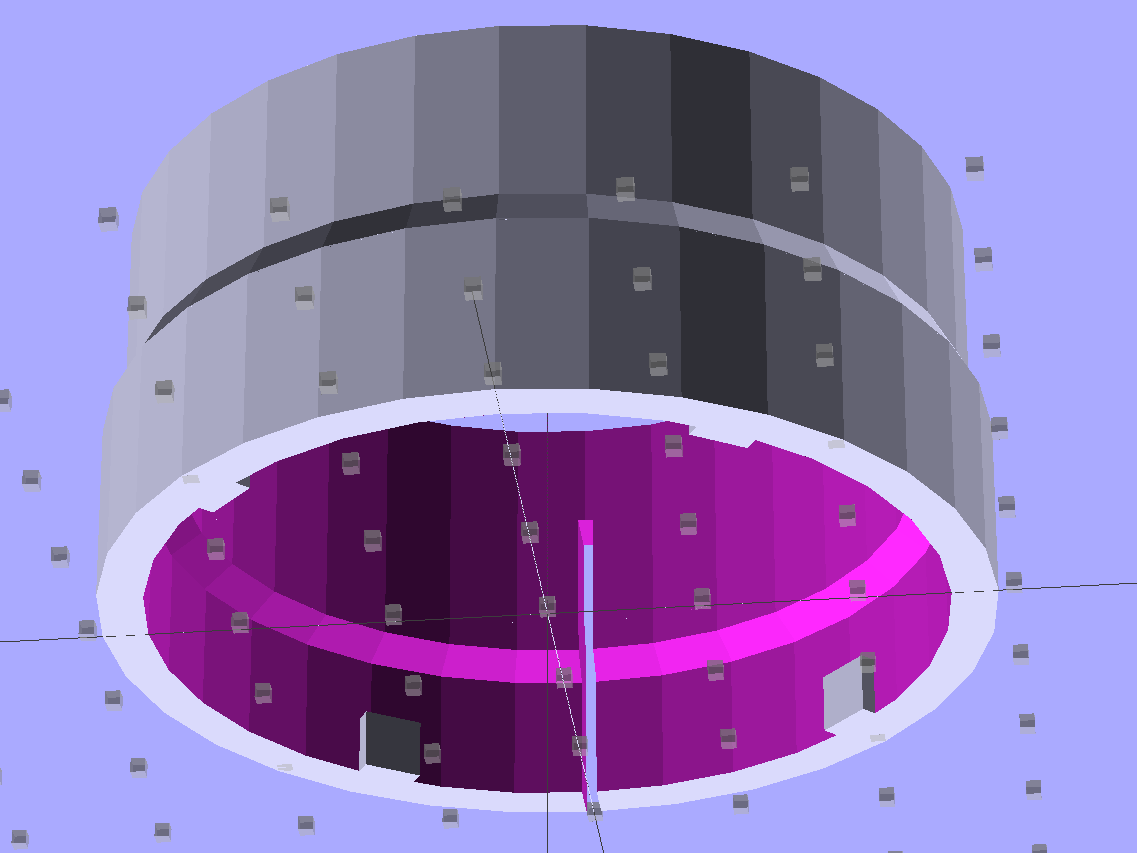
The bottom view, looking up through the layer of 1 mm cubes defining the Z=0 plane, shows the lugs:
Bushing Solid Model – bottom
I thought the slit would provide enough springiness to let the lugs bump over the ridges, but it wasn’t quite enough: the relatively stiff ABS isn’t nearly as springy as the original black plastic for about the same thickness. For the next version, I’ll try four slits, all of which must end at different levels to avoid concentrating the stress on a single layer.
In any event, it came out about like you’d expect:
Handle Bushing – on platform
As with many projects, though, I had to make a pair of simpler prototypes to get the measurements correct. The lugs, for example, are not 90° apart, spaced neatly around the handle’s midline seam, as I assumed for Prototype 1 on the right:
Handle bushings – prototypes 2 and 1
Prototype 2, on the left, has a support structure holding up a horizontal step that butted against the handle, which turned out to be unnecessary. The OpenSCAD version substitutes a pair of conical transitions that worked much better; they’re at different levels with a thicker wall section between them.
With the ring and somewhat preshrunk heatshrink tubing slipped along the hose, rewiring proceeds in reverse order. Next time, I’ll add a QD fitting in the hose-to-socket wire so I can take the whole thing apart again without cutting that wire:
Samsung Vacuum Handle – wiring detail
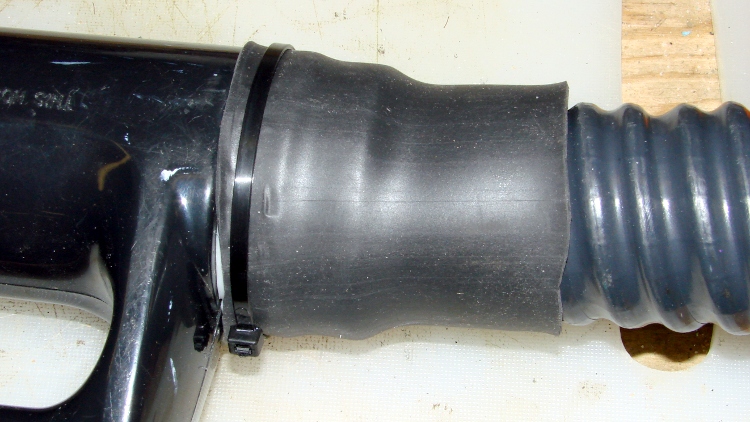
Assemble the handle, snap the glaring white strain relief fitting in place, shrink the tubing, add a cable tie mostly for show:
Samsung Vacuum Handle – heatshrink over bushing
I cut a few slits in the tubing’s end to improve its bendiness, but it’s already Much Better than it was.
A few things I’d do differently:
Add a recess for the cable tie, with a flat spot for its latch
Four slits, not just one
Ribs on the snout to help anchor the tubing
Longer snout?
The OpenSCAD source code for the final version, with a module for the support ring that you won’t need:
// Samsung Vacuum cleaner hose bushing
// Ed Nisley KE4ZNU January 2013

// Layout options

Layout = "Build";
                    // Overall layout: Show Build
                    // Parts: Ring Sleeve

//- Extrusion parameters must match reality!
//  Print with +1 shells and 3 solid layers

ThreadThick = 0.25;
ThreadWidth = 2.0 * ThreadThick;

HoleWindage = 0.75;

function IntegerMultiple(Size,Unit) = Unit * ceil(Size / Unit);

Protrusion = 0.1;           // make holes end cleanly

//----------------------
// Dimensions

HoseOD = 47.0;					// spiral tube diameter
TubeWall = 1.4;					// heatshrink tubing wall thickness
HandleRingLong = 8.5;			// length of ring stub on handle

RingID = 51.0;					// lock ring over handle end
RingOD = 58.0;
RingLong = 12.0;

Locks = 4;						// bumps inside lock ring
LockLength = 4.0;
LockWide = 4.0;
LockThick = 0.75;

LockAngleOffset = 52.0;			// offset of lock bump from handle top dead center
LockAngleIncluded = 102.4;		// between first and second lock bump (also 3 & 4)
LockAngles = [-LockAngleOffset,
				-(LockAngleOffset+LockAngleIncluded),
				-(LockAngleOffset+180),
				-(LockAngleOffset+LockAngleIncluded+180)];

BushID = HoseOD + 1.0;			// over spiral hose
BushOD = RingOD - 2*TubeWall;	// allow flush heatshrink fit
BushLength = 15.0;

SlitWidth = 2*ThreadWidth;		// allow expansion of lock ring, sorta kinda
SlitHeight = 20.0;
SlitAngle = 0;
SlitLength = max(RingOD,BushOD);

RingSides = 4*8;
RingAlign = 360/(2*RingSides);
$fn = RingSides;

//----------------------
// Useful routines

module PolyCyl(Dia,Height,ForceSides=0) {           // based on nophead's polyholes

Sides = (ForceSides != 0) ? ForceSides : (ceil(Dia) + 2);

FixDia = Dia / cos(180/Sides);

cylinder(r=(FixDia + HoleWindage)/2,
         h=Height,
         $fn=Sides);
}

module ShowPegGrid(Space = 10.0,Size = 1.0) {

    Range = floor(50 / Space);

    for (x=[-Range:Range])
        for (y=[-Range:Range])
            translate([x*Space,y*Space,Size/2])
            %cube(Size,center=true);

}

//-------------------
// Component parts

module Ring() {
	union() {
		difference() {
			union() {
				cylinder(r=RingOD/2,h=(RingLong + Protrusion));
				translate([0,0,RingLong])
					cylinder(r1=(RingOD/2),r2=(BushOD - Protrusion)/2,h=(RingOD - BushOD));
			}
			translate([0,0,-Protrusion]) {
				PolyCyl(RingID,(HandleRingLong + Protrusion),RingSides);
				cylinder(r=BushID/2,h=(2*RingLong));
			}
			translate([0,0,(HandleRingLong - Protrusion)])
				cylinder(r1=((RingID/2) / cos(180/RingSides) + HoleWindage),
						 r2=BushID/2,
						 h=(RingID - BushID)/2);
		}
		for (i=[0:Locks-1])
			rotate(LockAngles[i] + RingAlign)
				translate([(RingID/2),0,LockWide/2])
					cube([2*LockThick,LockLength,LockWide],center=true);
	}
}

module Sleeve() {
	difference() {
		cylinder(r=BushOD/2,h=(BushLength + Protrusion));
		translate([0,0,-Protrusion])
			cylinder(r=BushID/2,h=BushLength + 3*Protrusion);
	}
}

module Bushing() {
	difference() {
		union() {
			Ring();
			translate([0,0,RingLong])
				Sleeve();
		}
		rotate(SlitAngle)
			translate([SlitLength/2,0,(SlitHeight - Protrusion)/2])
				cube([SlitLength,SlitWidth,(SlitHeight + Protrusion)],center=true);
	}
}

// This turned out to be unnecessary after tapering the transitions
module Support() {

SuppHeight = RingLong - ThreadThick;

	color("Yellow")
	union() {
		difference() {
			cylinder(r=(RingID/2 - LockThick - ThreadWidth/2),h=SuppHeight);
			translate([0,0,-Protrusion])
				cylinder(r=(BushID/2 - ThreadWidth),h=2*RingLong);
			for (i=[0:RingSides-1])
				rotate(i*2*RingAlign)
					translate([RingID/4,0,SuppHeight - ThreadThick/2 + Protrusion/2])
						cube([RingID/2,(LockLength - 3*ThreadWidth),(ThreadThick + Protrusion)],center=true);
		}
	}
}

//----------------------
// Build it!

ShowPegGrid();

if (Layout == "Build")
	union() {
		Bushing();
//		Support();
	}

if (Layout == "Show")
	Bushing();

if (Layout == "Ring")
	Ring();

if (Layout == "Sleeve")
	Sleeve();

if (Layout == "Support")
	Support();
Starting in late 2006, I’ve have several Hobo dataloggers recording the temperature / humidity / light at various locations, under the principle that if you observe something long enough, it turns into science. Regrettably, logging the data is one thing, actually processing it into usable information is entirely another; there’s never a good time for the latter. Perhaps if I break it down into monthly chunks, I can actually make some progress on getting it done.
The first problem is that the Hobo dataloggers lack a convenient user interface: the only way to extract data is through the Hoboware graphical program. Unfortunately, Hoboware stores the extracted data in their proprietary format, locked away from any other program. I eventually discovered the configuration setting that automatically saves the data in CSV format, but I didn’t find that until rather late in the game, didn’t always set it with new versions, and it seems their CSV format has changed slightly over the years. Thus, one of my to-do items is to manually process the remaining Hoboware files to produce the corresponding CSV files, then convert those into a standard format that’s useful with, say, Gnuplot.
The intent is that I can simply concatenate all the CSV data files for a given sensor, run them through a Bash script to sanitize the data, plot what emerges, and then maybe slice-and-dice the data a few different ways. The less manual processing this requires, the more it will get done…
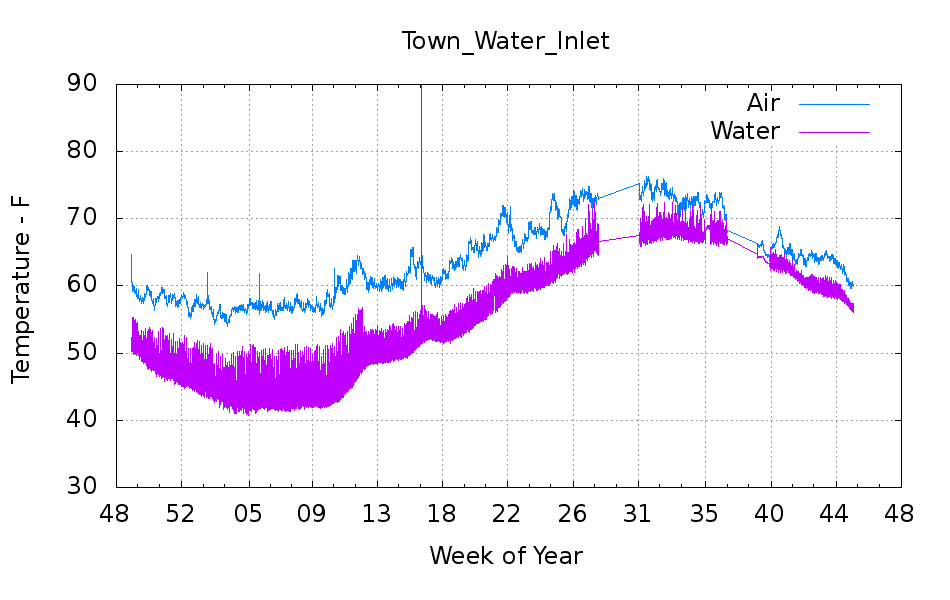
But the first step is to show that something emerges from the data, so here’s the last year of data (recorded in 2012, which includes a bit of 2011 and not quite up to the end of 2012) from the logger that’s been monitoring the air temperature of the Basement Laboratory and the temperature at the house water inlet. I assume the minimum water temperature on the pipe at the basement wall tracks the ground temperature four or five feet down from the surface; more on the hardware behind the data in a while.
Town_Water_Inlet
The fuzz on the purple trace shows the relatively rapid temperature variation as we draw water from the supply: it falls as water moves into the house and rises as still water warms. The inlet always remains cooler than the air temperature, because it’s cemented to the wall, but a closer look (again, in a while) shows a nice exponential curve. The thin straight-line sections show gaps in the data record: sometimes I forget to do my monthly science for a few days or weeks.
An extract from the CSV files, including some data not plotted above:
"Plot Title: Town Water Inlet "
"#","Time, GMT-04:00","Temp, °F","RH, %","Temp, °F","Host Connected","Stopped","End Of File"
1,09/25/2012 09:20:00,66.344,58.707,64.632,,,
2,09/25/2012 09:25:00,66.173,57.579,64.459,,,
-- snippage --
12962,11/09/2012 09:25:00,60.174,54.301,56.685,,,
12963,11/09/2012 09:28:48,,,,Logged,,
12964,11/09/2012 09:28:55,,,,,Logged,Logged
-- snippage --
"Plot Title: Town Water Inlet "
"#","Time, GMT-05:00","Temp, °F()","RH, %()","Temp, °F()","End Of File()"
1,11/09/12 08:35:00 ,64.247,52.282,56.728,
2,11/09/12 08:40:00 ,63.304,51.465,56.728,
-- snippage --
14473,12/29/12 14:35:00 ,56.599,51.454,48.895,
14474,12/29/12 14:40:00 ,56.599,51.485,49.116,Logged
A touch of sed can handle the reformatting I’ve seen so far:
Convert headers to comments: sed 's/^\"/#&/'
Convert non-data events to comments: sed 's/^.*Logged/#&/'
Remove spurious trailing blanks in data fields: sed 's/ ,/,/'
Here’s the Bash and Gnuplot source code that produced the graph, complete with cruft that may come in handy later:
#!/bin/sh
#-- overhead
export GDFONTPATH="/usr/share/fonts/truetype/"
base="${1%.*}"
echo Base name: ${base}
tfile1=$(tempfile)
tfile2=$(tempfile)
ofile=${base}.png
echo Input file: $1
echo Temporary files: ${tfile1} ${tfile2}
echo Output file: ${ofile}
#-- prepare csv Hobo logger file
sed 's/^\"/#&/' $1 > ${tfile1}
sed 's/^.*Logged/#&/' ${tfile1} > ${tfile2}
#-- do it
gnuplot << EOF
#set term x11
set term png font "arialbd.ttf" 18 size 950,600
set output "${ofile}"
set title "${base}"
set key noautotitles
unset mouse
set bmargin 4
set grid xtics ytics
set timefmt "%m/%d/%Y %H:%M:%S"
set xdata time
set xlabel "Week of Year"
set format x "%W"
#set xrange [1.8:2.2]
#set xtics 0,5
#set mxtics 2
#set logscale y
#set ytics nomirror autofreq
set ylabel "Temperature - F"
#set format y "%4.0f"
set yrange [30:90]
#set mytics 2
#set y2label "right side variable"
#set y2tics nomirror autofreq 2
#set format y2 "%3.0f"
#set y2range [0:200]
#set y2tics 32
#set rmargin 9
set datafile separator ","
#set label 1 "label text" at 2.100,110 right font "arialbd,18"
#set arrow from 2.100,110 to 2.105,103 lt 1 lw 2 lc 0
plot	\
    "${tfile2}" using 2:3 with lines lt 3 title "Air", \
    "${tfile2}" using 2:5 with lines lt 4 title "Water"
EOF
The tiny Lenovo Q150 has become the dedicated Windows box for running TurboTax this season. In earlier years, I used the Token Windows Laptop through a remote desktop session that appears on a Xubuntu desktop, but the Q150 runs rings around the old laptop.
This time, no matter what I tried, I couldn’t connect to the Windows 7 desktop on the Q150 from my Xubuntu desktop. The usual search results suggested Windows configuration settings that didn’t quite match what the Q150 provided; a bit more searching revealed that Windows 7 Home flavors of the OS (this one is Home Premium) lack the Remote Desktop Protocol server required to export the desktop. The Q150 could act as a client that controlled another machine’s desktop server, but not the other way around.
The suggested solutions required applying patches, in the form of EXE files downloaded from sketchy websites, or dropping in replacement DLLs obtained from similar sites. All that seems like Bad Practice, particularly for a Windows box used to prepare our taxes, and I was unwilling to proceed along those lines.
Instead, I fetched UltraVNC, installed it on the Q150, and it works perfectly. Remmina occasionally requires a resize-window-to-match-server at startup and then it’s all good.
From what I hear, Windows 7 doesn’t display the classic Blue Screen of Death nearly so often as before, although I did manage to lock it up during the course of this adventure. That’s OK, I can still use my favorite Windows wallpaper image:
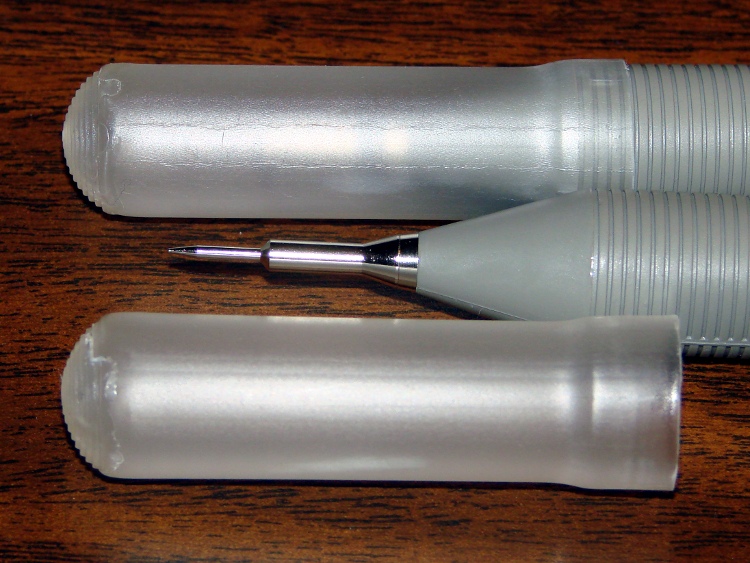
Our Larval Engineer received a logic probe / pulser set for Christmas:
RSR Logic Probe Pulser Set – with formed covers
They’re the low-cost RSR-611 and -620 from the usual eBay vendor, not my ancient HP10525/10526 set, but they should suffice. Perhaps nobody uses logic probes these days, what with most of the parts being too small for even a needle tip, but …
Anyhow, they didn’t have caps over the sharp probe tips, so I rummaged around until I found the stash of cigar tubes (some of which went into that air flow straightener) that were about the right size. I thought about 3D printing an adapter between tubes and probes:
RSR Probe Cap Adapter – solid model
It’s actually a subtractive kind of thing, with a model of the probe tip subtracted from a suitable cylindrical object:
RSR Logic Probe – solid model
But then I realized the tubes were thermoplastic, held each one over a stove burner until the open end went transparent and droopy, rammed it down over the probe tip, and trimmed off the ragged edge. Worked fine, fits securely, and even looks pretty good:
RSR Covers – detail
I’ll never print the adapters, but maybe one of us will tweak the model to do something else…
The OpenSCAD source code:
// RSR Logic Probe / Pulser Cap
// Ed Nisley KE4ZNU December 2012

// Adapts cigar tube to probe body

// Layout options

Layout = "Build";
                    // Overall layout: Show Build
			// Parts: Probe

//- Extrusion parameters must match reality!
//  Print with +1 shells and 3 solid layers

ThreadThick = 0.25;
ThreadWidth = 2.0 * ThreadThick;

HoleWindage = 0.2;

function IntegerMultiple(Size,Unit) = Unit * ceil(Size / Unit);

Protrusion = 0.1;           // make holes end cleanly

//----------------------
// Dimensions

ProbeDia = 18.0;				// dia of main body
ProbeTipDia = 6.8;				// dia at end of plastic cone
ProbeTipLen = 30.0;				// length of metal ferrule + tip
ProbeConeLen = 17.5;			// cone taper length

TubeOD = 17.25;
TubeWall = 0.50;
TubeID = TubeOD - 2*TubeWall;

TubeLen = 15;					// slip fit over tube body

BodyLen = 20;					// slip fit over probe body

WallThick = 3.5*ThreadWidth;		// basic adapter wall thickness

AdapterLen = TubeLen + BodyLen;
AdapterOD = ProbeDia + 2*WallThick;
AdapterSides = 4*4;

//----------------------
// Useful routines

module PolyCyl(Dia,Height,ForceSides=0) {           // based on nophead's polyholes

Sides = (ForceSides != 0) ? ForceSides : (ceil(Dia) + 2);

FixDia = Dia / cos(180/Sides);

cylinder(r=(FixDia + HoleWindage)/2,
         h=Height,
         $fn=Sides);
}

module ShowPegGrid(Space = 10.0,Size = 1.0) {

    Range = floor(50 / Space);

    for (x=[-Range:Range])
        for (y=[-Range:Range])
            translate([x*Space,y*Space,Size/2])
            %cube(Size,center=true);

}

module Probe() {
	union() {
		cylinder(r=((ProbeDia + HoleWindage)/2),
				 h=(BodyLen + 1.2*Protrusion),$fn=2*AdapterSides);
		translate([0,0,(BodyLen + Protrusion)])
			cylinder(r1=(ProbeDia + HoleWindage)/2,
					 r2=ProbeTipDia/2,
					 h=ProbeConeLen,$fn=2*AdapterSides);
		cylinder(r=ProbeTipDia/2,h=(BodyLen + ProbeConeLen + ProbeTipLen),$fn=2*AdapterSides);
	}
}

module ProbeSleeve() {

	difference() {
		cylinder(r=AdapterOD/2,h=AdapterLen);
		translate([0,0,-Protrusion])
			Probe();
		PolyCyl((TubeOD + HoleWindage),(AdapterLen + Protrusion),2*AdapterSides);
	}
}

//----------------------
// Build it!

ShowPegGrid();

if (Layout == "Show")
    ProbeSleeve();

if (Layout == "Build")
    translate([0,0,AdapterLen])
		rotate([180,0,0])
			ProbeSleeve();

if (Layout == "Probe")
	Probe();
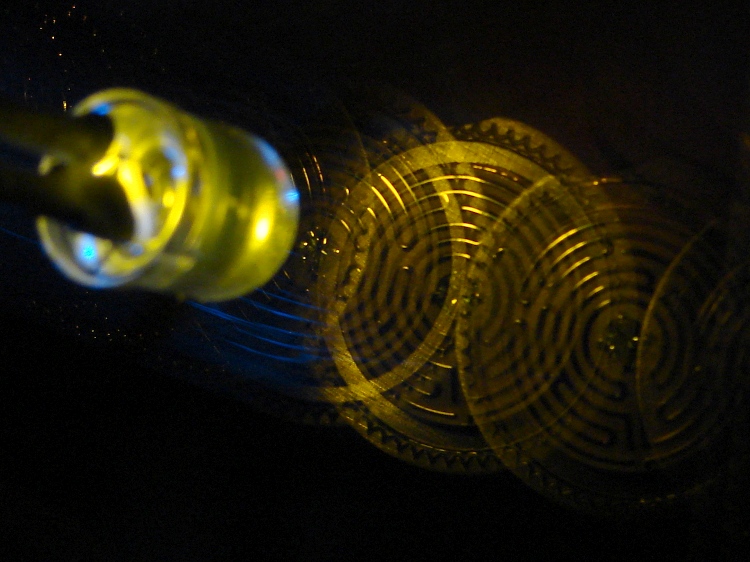
A bit of fiddling with the Arduino PWM hardware can turn a white LED into a stroboscopic tachometer to chop smooth motion into chunks:
Strobe – Maze 1 – 50 Hz 100 us
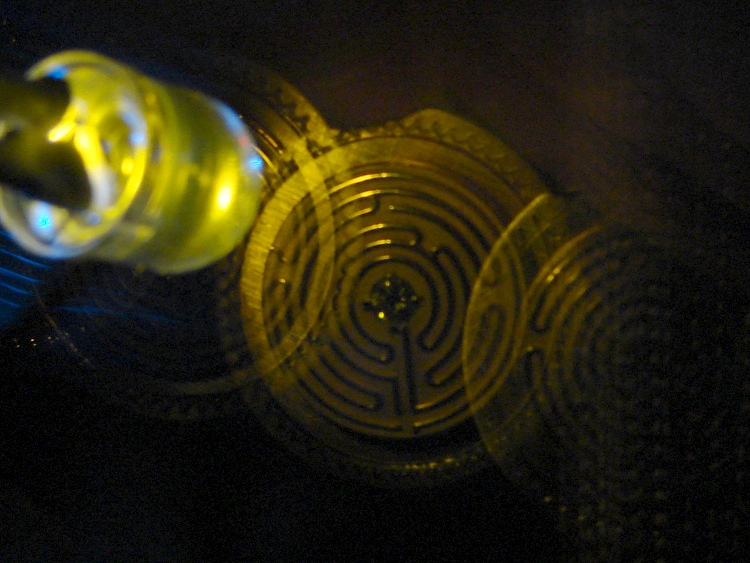
I was moving that pendant by hand and slight speed changes were easily visible:
Strobe – Maze 2 – 50 Hz 100 us
IBMers of a certain era may recognize the test object; the rest of you can go there.
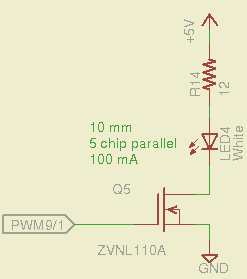
That’s a 10 mm warm-white LED with 5 parallel chips, running at about 100 mA from a 5 V supply, and driven from the same PWM channel and MOSFET that used to drive also drives the red channel of the RGB LED Mood Light:
White LED Strobe
The ZVNL110A MOSFET has a 3 Ω drain resistance, which becomes a significant part of the resistance; you’d want a bigger, better, lower resistance MOSFET to wring more light out of the LED. In fact, I ran the LED from 12 V with the same resistor at a few hundred mA.
The reason you need more light is to make up for the minuscule duty cycle. In order to “stop motion”, you want a very short pulse; I picked a 100 μs pulse. At 50 Hz, that works out to a 0.5% duty cycle: not much light at 100 mA, but OK for a demo.
You can’t do this with the standard Arduino PWM setup, because it produces a constant frequency (about 488 Hz) and varies the duty cycle; we need a variable frequency with a constant pulse length. Because a stroboscope needs fine-grained control over the frequency, in order to stop the motion of rotating objects, it should run from one of the 16 bit Timer1 PWM outputs, which means either PWM9 or PWM10. Note that simply changing the timer’s clock prescaler as described there won’t suffice, because that gives very coarse control of the PWM frequency.
It’s probably worth noting that trying to do precise timing purely in software with, say, the millis() and micros() functions, produces terrible results…
The Arduino timer hardware includes control over both the period and the duration of the output pulses. The Fine Manual describes all the timer configuration registers starting on page 109; see that post for a push-pull PWM driver that formed the basis of this one.
Fast PWM (Mode 14) has some useful characteristics:
Single-slope operation: timer counts only upward
Output PWM9 goes high when TCNT1 resets to 0
Output PWM9 goes low when TCNT1 = OCR1A
TCNT1 resets when TCNT1 = ICR1
The lowest possible output frequency occurs with ICR1 = 0xffff, so that Timer1 counts from 0x0000 to 0xffff before resetting (which, in that case, is indistinguishable from simply wrapping). The wrap period = ICR1 * tick period and the corresponding frequency = 1 / period.
The clock prescaler determines the overall range of Timer1 by setting the tick period. The Clock Select bit field can take on 6 useful, albeit widely separated, values (the other two select the external clock pin):
0 – stop timer
1 – prescale 1:1 = 62.5 ns tick → 244 Hz
2 – prescale 1:8 = 500 ns tick → 30 Hz
3 – prescale 1:64 = 4 μs tick → 3.8 Hz
4 – prescale 1:256 = 16 μs tick → 0.95 Hz
5 – prescale 1:1024 = 64 μs tick → 0.24 Hz
For my purposes, a lower limit around 4 Hz seemed about right. That means CS = 3, the prescaler runs at 1:64, and the timer ticks at 4 μs.
The frequency upper limit could be just under 1/(pulse width), which would produce a very high duty cycle. I arbitrarily set the limit to 1/(4 × pulse width), for a 25% duty cycle that works out to 1/(4 × 100 μs) = 2.5 kHz = 150 k flash/min. If you’re using very high current drive, then limit the duty cycle to prevent toasting the LED.
Because a strobe tach needs quick & easy adjustment, the encoder knob tweaks the pulse frequency in 1 Hz steps. Pushing the knob to close the shaft switch (if you have such a knob, of course, otherwise use another button; they all do the same thing here) reduces the step size to 0.01 Hz, which is more useful for fine tuning when you’re close to the goal. A real application requires better control over the numeric values (probably using integer values); I used floating point and simply ignored all the usual roundoff issues:
Shut off interrupts to prevent interference with the high byte storage register
Stop the timer: CS=0
Load the new upper limit in ICR1
Force TCNT1 to be just below IRC1 to terminate the current pulse
Start the timer: CS=3
Enable interrupts again
You’d probably plunk that into a separate function in a real program…
Printing the frequency becomes a hassle without floating point formatting in printf(). It should appear on the character LED display, too. Optionally / additionally showing the value in rev/min would be very nice.
You’d want to increment the frequency by some reasonable fraction of the current value, perhaps rounded to 1 / 2 / 5 / 10 percent steps. Larger steps by pushbutton? Truncate the current value to a multiple of the step size?
You would also want some way to adjust the flash duration, but that’s definitely in the nature of fine tuning.
As it stands, a 100 μs pulse really does stop motion:
Fan stopped at 2500 rpm
That’s a fan running at about 2500 rpm, with the LED flashing at 41.86 Hz. The camera exposure is 1/2 sec @ f/3.5, handheld, which means the camera integrated about 20 flashes. Ambient light accounts for the background blur: I boosted the grossly underexposed image right out of darkness. The square on the hub is retroreflective tape for a laser tachometer that verified the speed.
Yes, half a second handheld. The morning tea wears off during the day…
In round numbers, 41.86 Hz = 23.9 ms / rev. The fan diameter is 86 mm, so the blade tips travel 1.1 mm = (270 mm / 23.9 ms) × 100 μs during each flash. The tips seem slightly blurred when you (well, I) look very closely in real life, but I think this lashup worked pretty well right off the sketchpad.
The Arduino source code:
// Stroboscopic Tachometer
// Ed Nisley - KE4ANU - December 2012

//----------
// Pin assignments

const byte PIN_KNOB_A = 2;			// knob A switch - must be on ext interrupt 2
const byte PIN_KNOB_B = 4;			//  .. B switch
const byte PIN_BUTTONS = A5;		//  .. push-close momentary switches

const byte PIN_STROBE = 9;			// LED drive, must be PWM9 = OCR1A using Timer1

const byte PIN_PWM10 = 10;			// drivers for LED strip, must turn these off...
const byte PIN_PWM11 = 11;

const byte PIN_SYNC = 13;			// scope sync

//----------
// Constants

const int UPDATEMS = 10;				// update LEDs only this many ms apart

#define TCCRxB_CS 0x03					// Timer prescaler CS=3 -> 1:64 division

const float TICKPD = 64.0 * 62.5e-9;	// basic Timer1 tick rate: prescaler * clock

enum KNOB_STATES {KNOB_CLICK_0,KNOB_CLICK_1};

// ButtonThreshold must have N_BUTTONS elements, last = 1024

enum BUTTONS {SW_KNOB, B_1, B_2, B_3, B_4, N_BUTTONS};
const word ButtonThreshold[] = {265/2, (475+265)/2, (658+475)/2, (834+658)/2, (1023+834)/2, 1024};

//----------
// Globals

float FlashLength = 0.1e-3;						// strobe flash duration in seconds
word FlashLengthCt = FlashLength / TICKPD;		//  ... in Timer1 ticks

float FlashFreq = 20.0;							// strobe flash frequency in Hz
float FlashPd = 1.0 / FlashFreq;				//  ... period in sec
word FlashPdCt = FlashPd / TICKPD;				//  ... period in Timer1 ticks

float FreqIncr = 1.0;							// default frequency increment
const float FreqMin = 4.0;
const float FreqMax = 1.0/(4.0*FlashLength);

volatile char KnobCounter = 0;
volatile char KnobState;

byte Button, PrevButton;

unsigned long MillisNow;
unsigned long MillisThen;

//-- Helper routine for printf()

int s_putc(char c, FILE *t) {
  Serial.write(c);
}

//-- Knob interrupt handler

void KnobHandler(void)
{
	byte Inputs;
	Inputs = digitalRead(PIN_KNOB_B) << 1 | digitalRead(PIN_KNOB_A);  // align raw inputs
//	Inputs ^= 0x02;                             // fix direction

	switch (KnobState << 2 | Inputs) {
	case 0x00 : 				// 0 00 - glitch
        break;
	case 0x01 : 				 // 0 01 - UP to 1
        KnobCounter++;
		KnobState = KNOB_CLICK_1;
		break;
	case 0x03 : 				 // 0 11 - DOWN to 1
        KnobCounter--;
		KnobState = KNOB_CLICK_1;
		break;
	case 0x02 : 				 // 0 10 - glitch
        break;
	case 0x04 : 				 // 1 00 - DOWN to 0
        KnobCounter--;
		KnobState = KNOB_CLICK_0;
		break;
	case 0x05 : 				 // 1 01 - glitch
        break;
	case 0x07 : 				 // 1 11 - glitch
        break;
	case 0x06 : 				 // 1 10 - UP to 0
        KnobCounter++;
		KnobState = KNOB_CLICK_0;
		break;
	default :  					// something is broken!
        KnobCounter = 0;
		KnobState = KNOB_CLICK_0;
	}
}

//-- Read and decipher analog switch inputs
//		returns N_BUTTONS if no buttons pressed

byte ReadButtons(int PinNumber) {

word RawButton;
byte ButtonNum;

	RawButton = analogRead(PinNumber);

	for (ButtonNum = 0; ButtonNum <= N_BUTTONS; ButtonNum++){
		if (RawButton < ButtonThreshold[ButtonNum])
			break;
	}

	return ButtonNum;

}

//------------------
// Set things up

void setup() {
	pinMode(PIN_SYNC,OUTPUT);
	digitalWrite(PIN_SYNC,LOW);	// show we arrived

	analogWrite(PIN_PWM10,0);			// turn off other PWM outputs
	analogWrite(PIN_PWM11,0);

	analogWrite(PIN_STROBE,1);			// let Arduino set up default Timer1 PWM
	TCCR1B = 0;							// turn off Timer1 for strobe setup
	TCCR1A = 0x82;						// clear OCR1A on match, Fast PWM, lower WGM1x = 14
	ICR1 = FlashPdCt;
	OCR1A = FlashLengthCt;
	TCNT1 = FlashLengthCt - 1;
	TCCR1B = 0x18 | TCCRxB_CS;			// upper WGM1x = 14, Prescale 1:64, start Timer1

	pinMode(PIN_KNOB_B,INPUT_PULLUP);
	pinMode(PIN_KNOB_A,INPUT_PULLUP);

	KnobState = digitalRead(PIN_KNOB_A);
	Button = PrevButton = ReadButtons(PIN_BUTTONS);

	attachInterrupt((PIN_KNOB_A - 2),KnobHandler,CHANGE);

	Serial.begin(9600);
	fdevopen(&s_putc,0);				// set up serial output for printf()

	printf("Stroboscope Tachometer\r\nEd Nisley - KE4ZNU - December 2012\r\n");

	printf("Frequency: %d.%02d\nPulse duration: %d us\n",
		   (int)FlashFreq,(int)(100.0 * (FlashFreq - trunc(FlashFreq))),
		   (int)(1e6 * FlashLength));

	MillisThen = millis();

}

//------------------
// Run the test loop

void loop() {

	MillisNow = millis();

	if ((MillisNow - MillisThen) > UPDATEMS) {

		digitalWrite(PIN_SYNC,HIGH);

		Button = ReadButtons(PIN_BUTTONS);
		if (PrevButton != Button) {
			if (Button == N_BUTTONS) {
//				printf("Button %d released\n",PrevButton);
				FreqIncr = 1.0;
			}
			else
//				printf("Button %d pressed\n",Button);
//				if (Button == SW_KNOB)
					FreqIncr = 0.01;
			PrevButton = Button;
		}

		if (KnobCounter) {
			FlashFreq += (float)KnobCounter * FreqIncr;
			KnobCounter = 0;

			FlashFreq = constrain(FlashFreq,FreqMin,FreqMax);
			FlashFreq = round(100.0 * FlashFreq) / 100.0;

			FlashPd = 1.0 / FlashFreq;
			FlashPdCt = FlashPd / TICKPD;

			noInterrupts();
			TCCR1B &= 0xf8;				// stop Timer1
			ICR1 = FlashPdCt;			// set new period
			TCNT1 = FlashPdCt - 1;		// force immediate update
			TCCR1B |= TCCRxB_CS;		// start Timer1
			interrupts();

			printf("Frequency: %d.%02d\n",
				   (int)FlashFreq,(int)(100.0 * (FlashFreq - trunc(FlashFreq))));
		}

		digitalWrite(PIN_SYNC,LOW);

		MillisThen = MillisNow;
	}

}
That’s a grandiose name for a blinking LED, if I ever saw one…