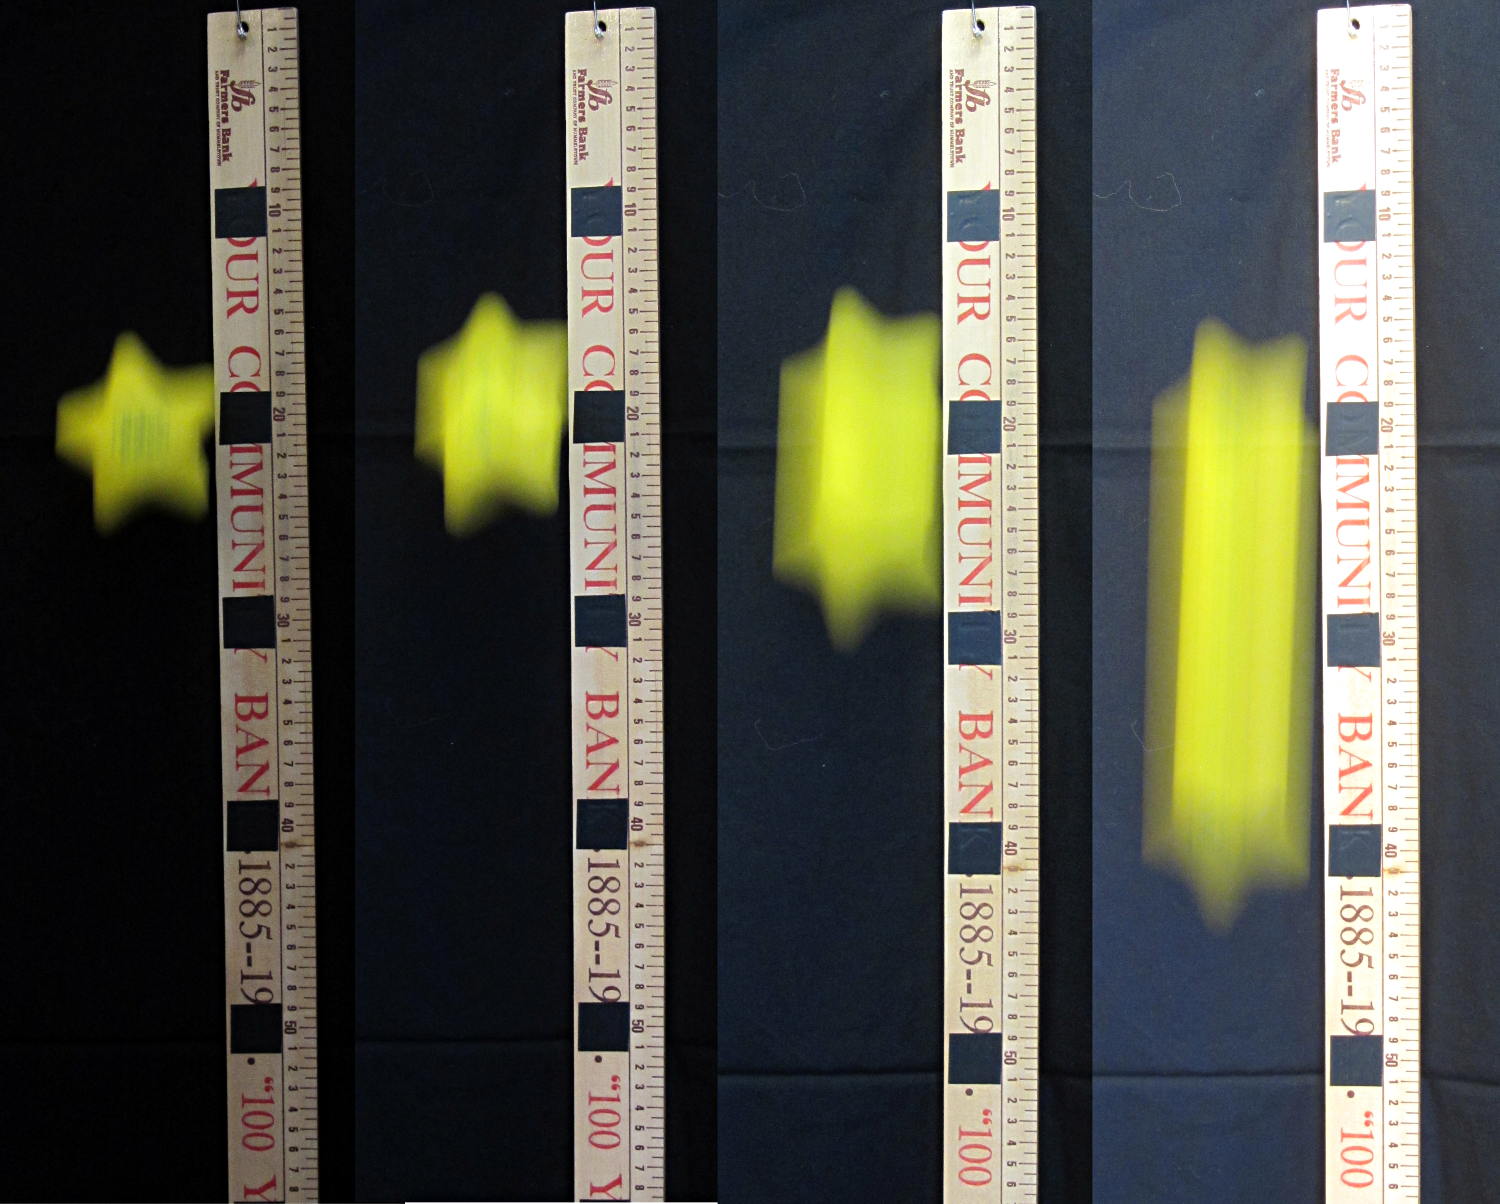
Small balls of modeling clay (2.2 g each, if you’re keeping score) make more tractable photographic targets than random benchtop clutter. The camera setup remains ISO 800, 1/10 s = 100 ms, f/8. The white LED blinks for 50 ms, starting 1 ms after the ball breaks the laser detector, and the Xenon strobe has a 1 µF capacitor.
Firing the Xenon flash 125 ms after the beam breaks produces intermittent results, with most shots being completely dark. That suggests the motion detection + shutter lag is roughly what I estimated based on the falling stars. Firing the flash earlier than 125 ms produces uniformly black images, so the lower numbers probably came from variations in my freehand release.
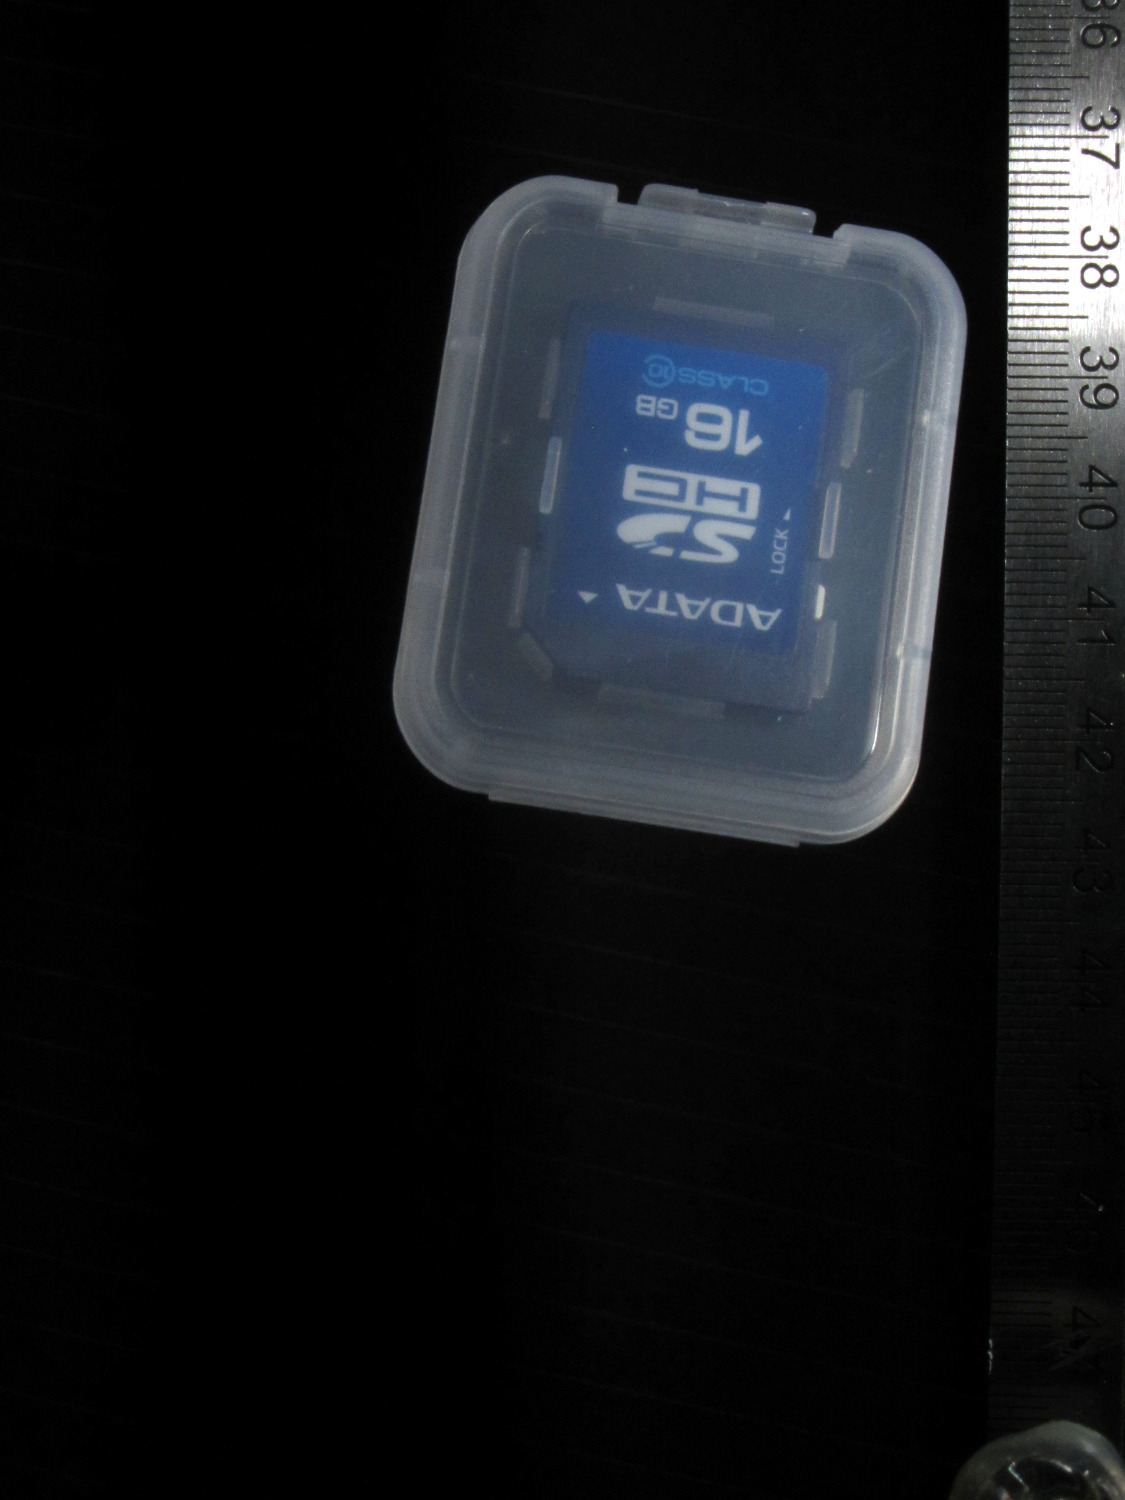
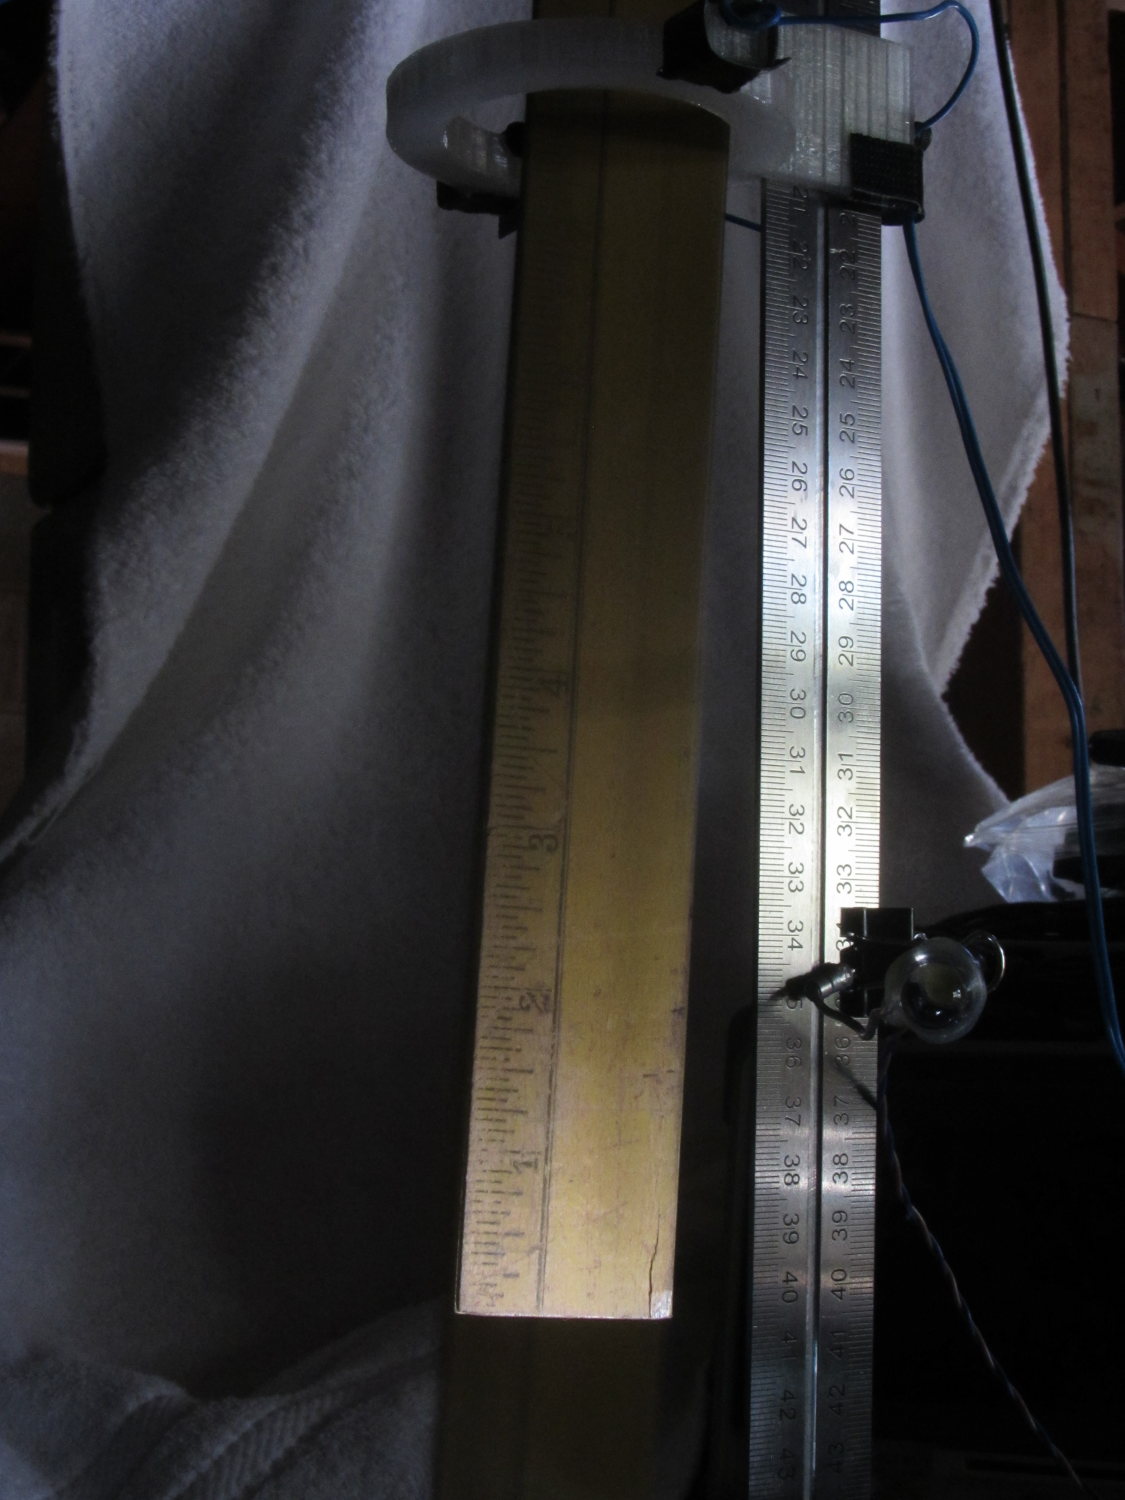
The ball at 125 ms:

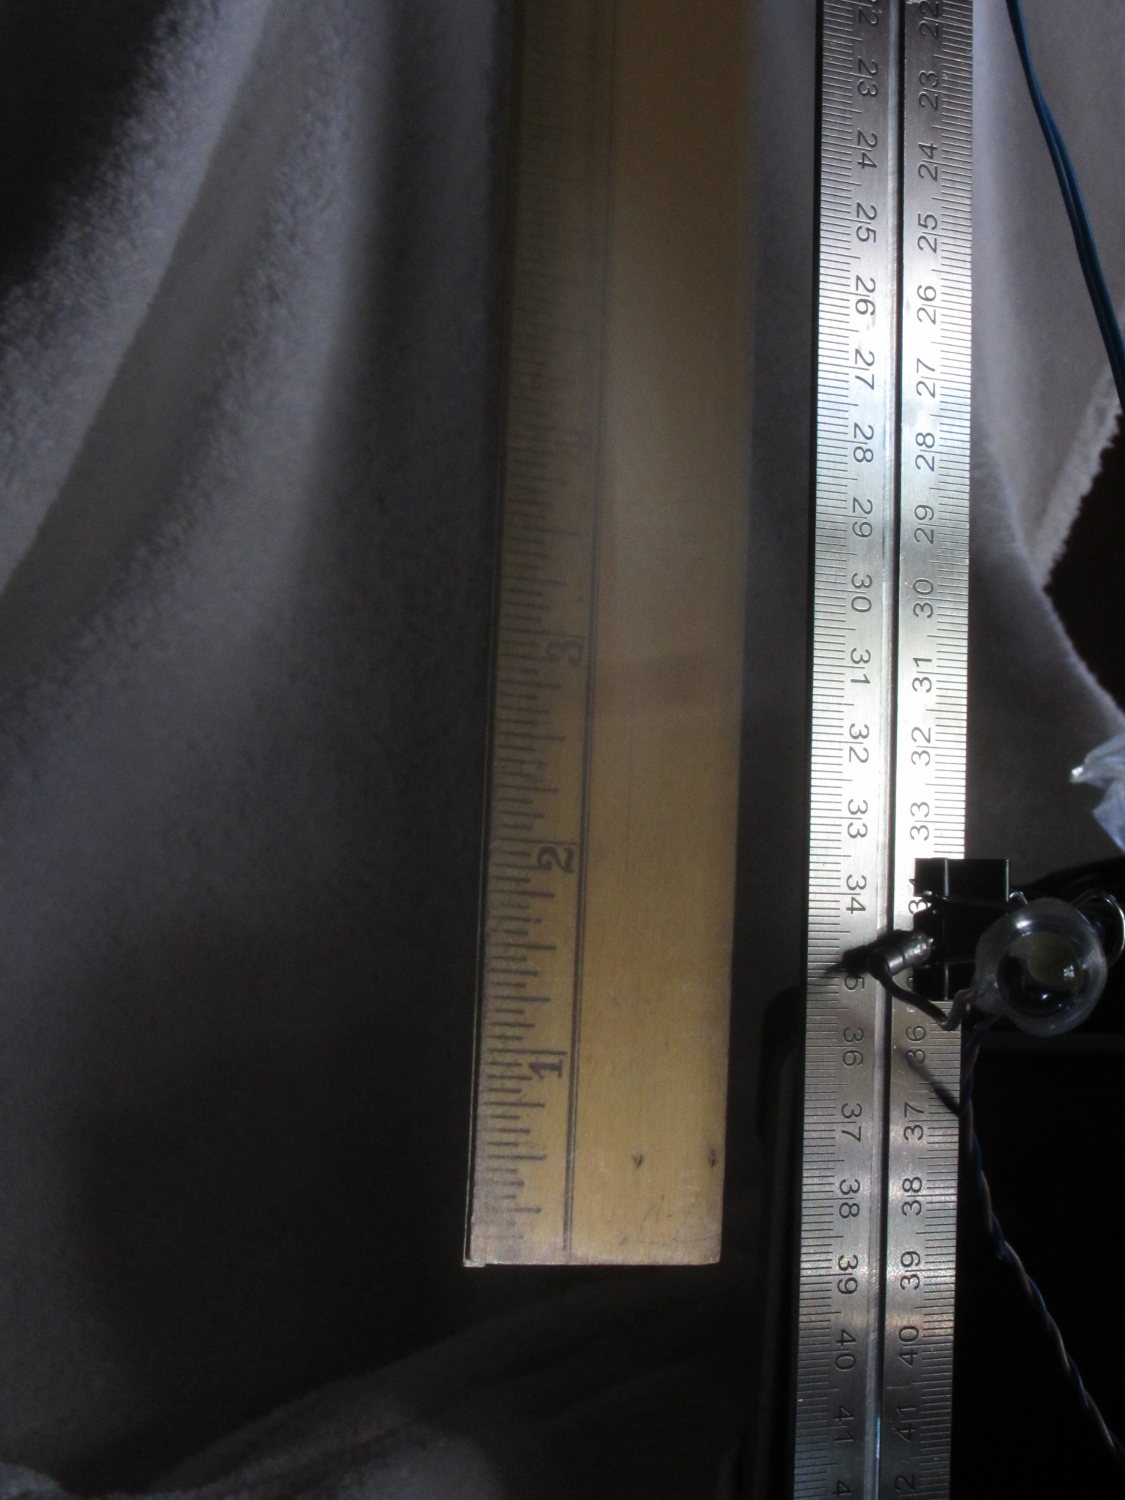
With the shutter set to 1/10 s = 100 ms, the shutter will close at about 220 ms and, indeed the results become intermittent at that time.
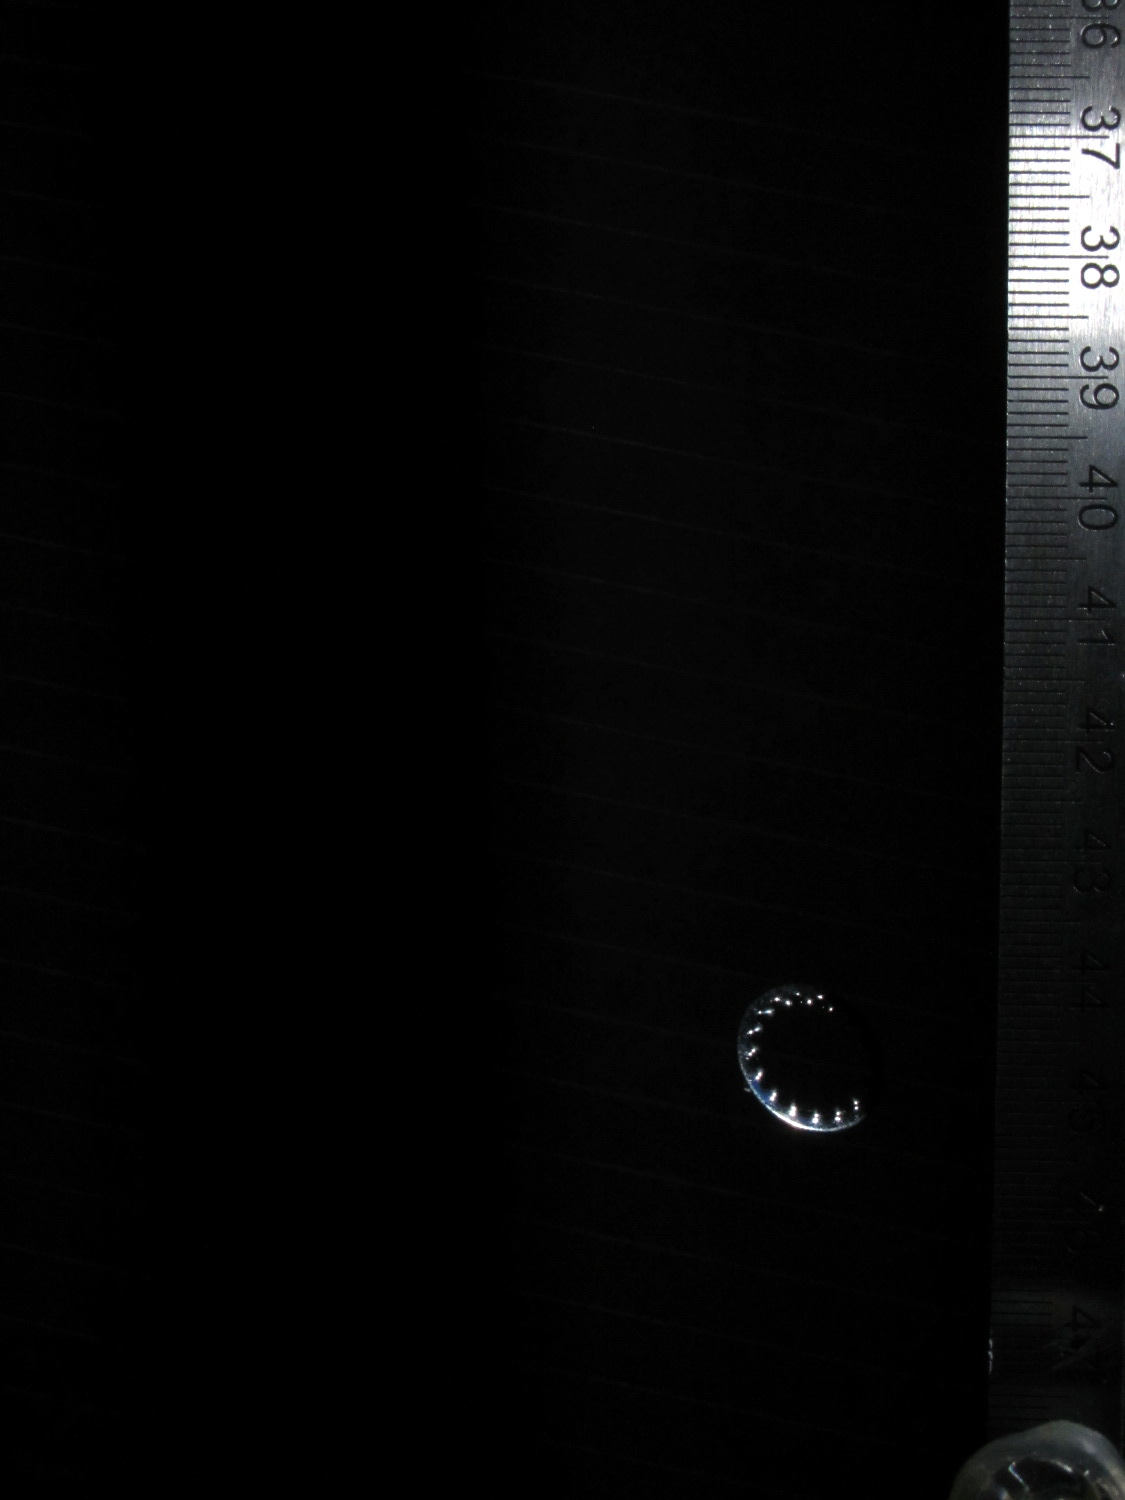
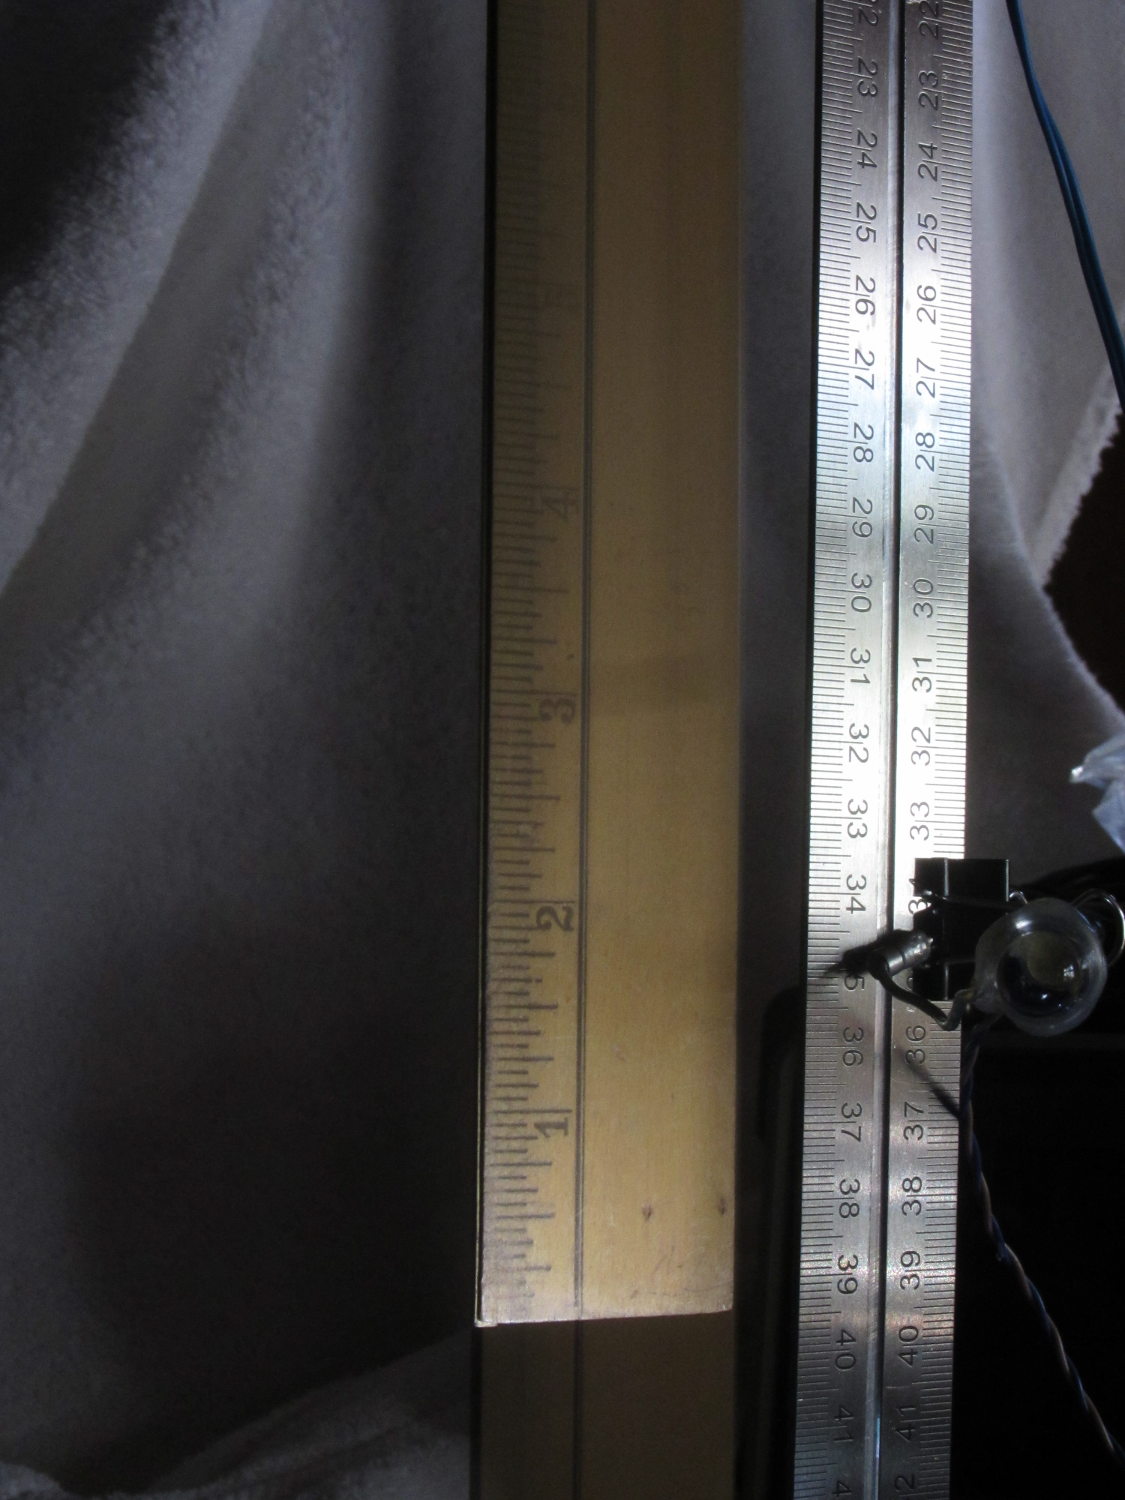
The ball at 200 ms:
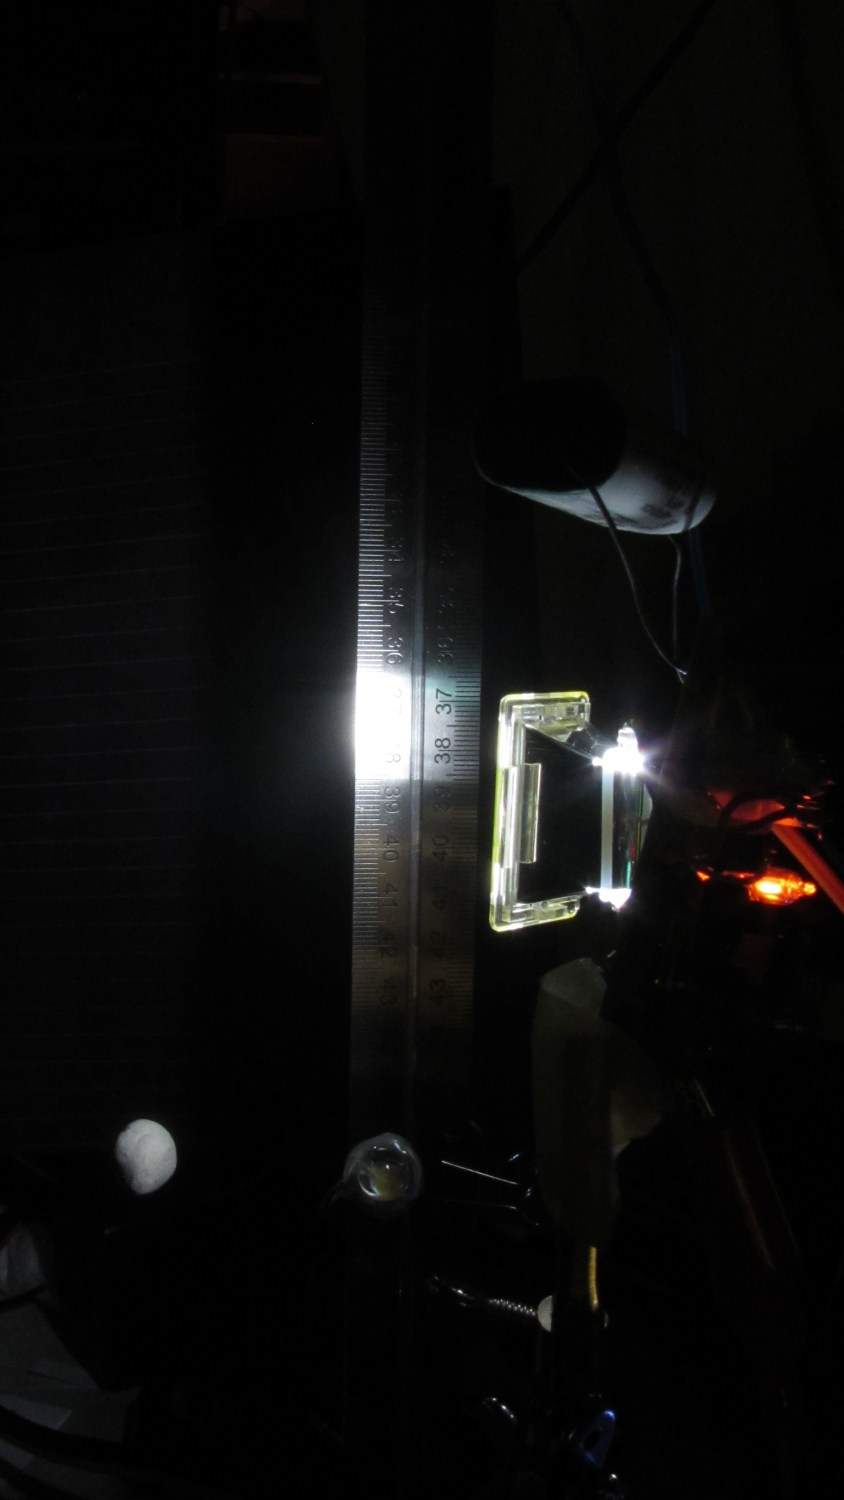
The 10 mm white LED that trips the CHDK motion detection script is just to the right of the ball in that picture. The orange glow to the right of the flash reflector comes from the unit’s neon “ready” indicator, which remains on until the flash happens.
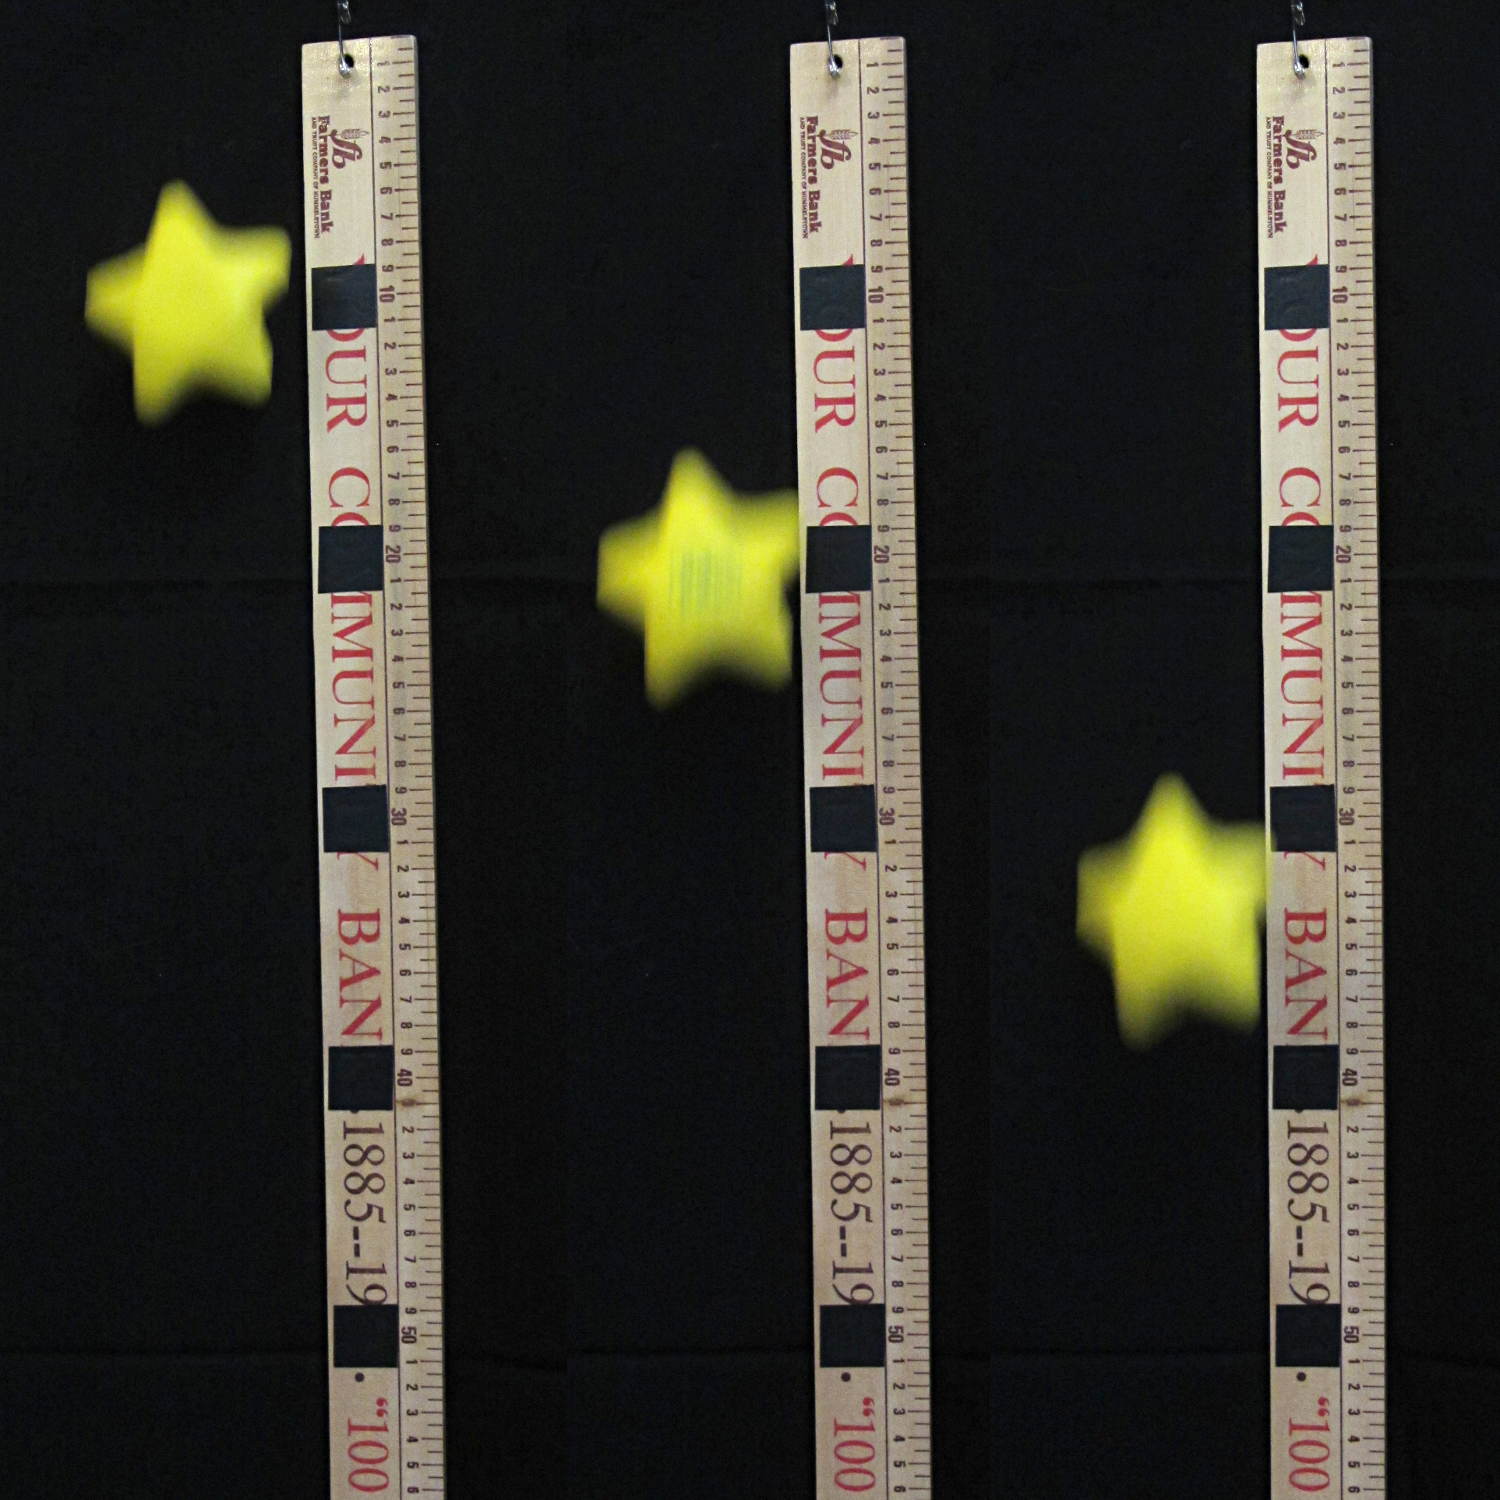
Dropping the ball by hand introduces considerable position jitter, mostly due to position error, early beam breaking, and general clumsiness. For example, here’s a composite view of eight successive drops captured at 200 ms after the beam break:
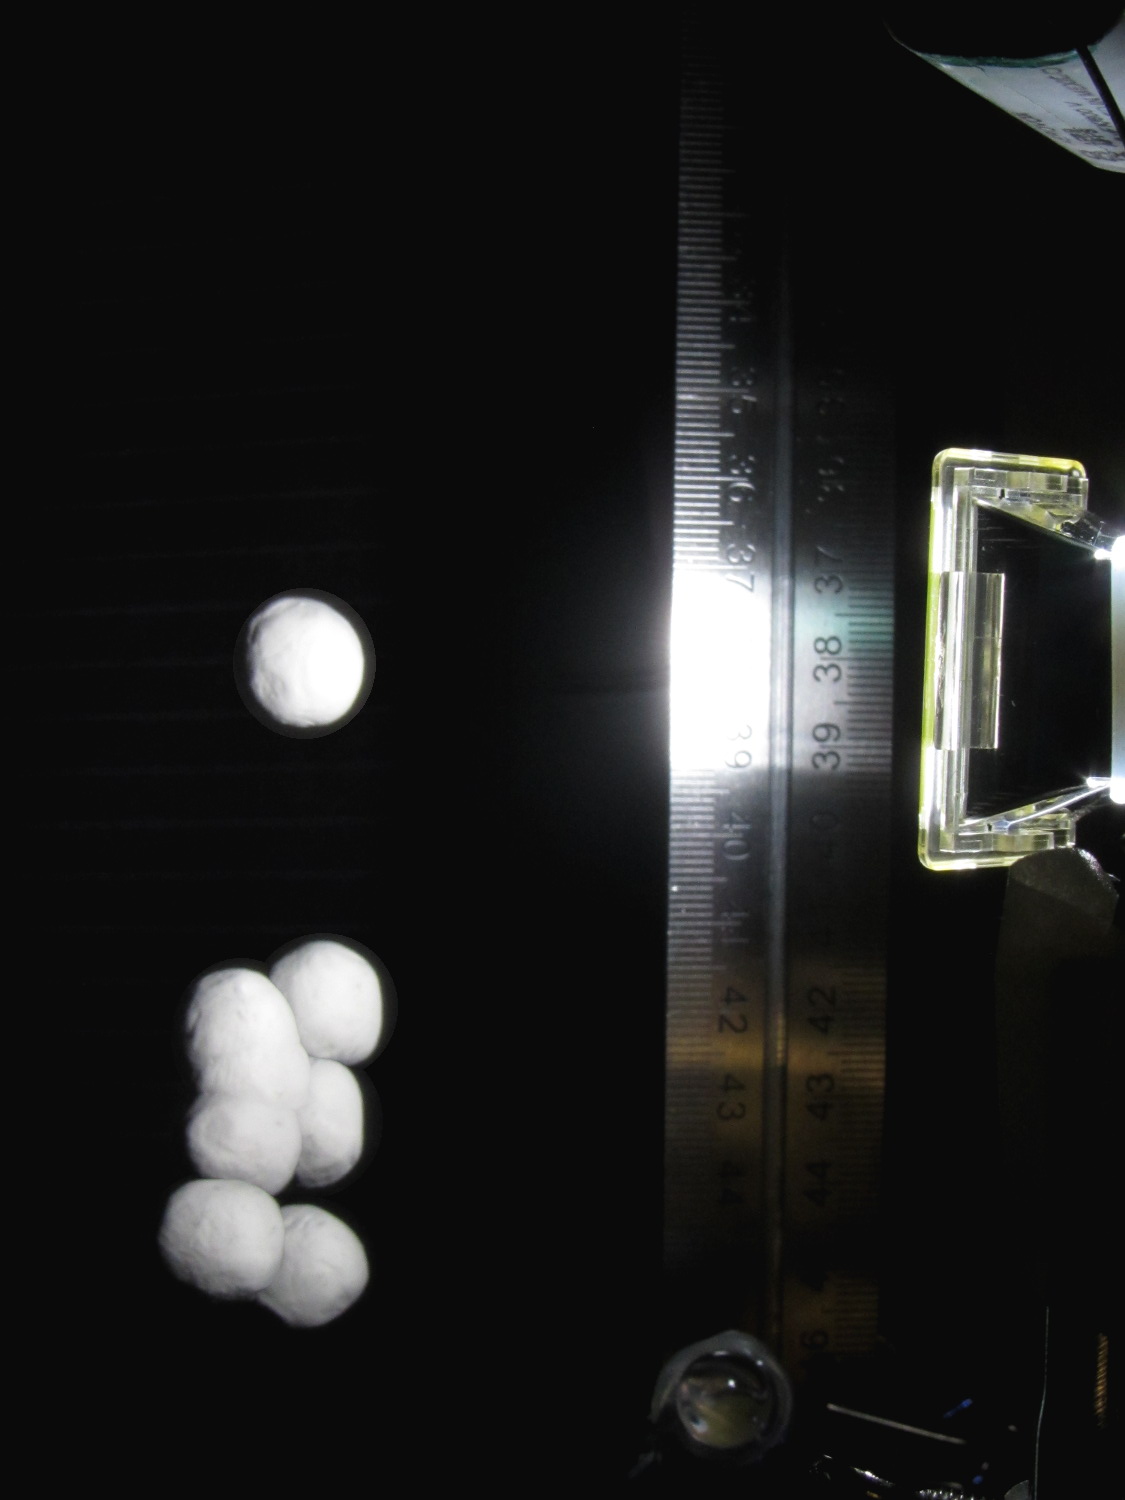
The lower seven images cover a range of 30 mm, with the outlier (most likely due to sticky clay on my fingers) 40 mm above the top of the cluster. That’s measured at the bottom of the balls, because that’s what breaks the beam.
At 200 mm below the beam, the balls are traveling about 2 mm/ms (from v2 = 2ax), so the timing variation in the cluster is 15 ms and the top one is 20 ms off.
Switching the camera to ISO 1600 produced black images; evidently that changes the shutter delay time by far more than I expected. I suspect the only way to be sure involves more drop tests with good light and that meter stick; I’m not that motivated right now.
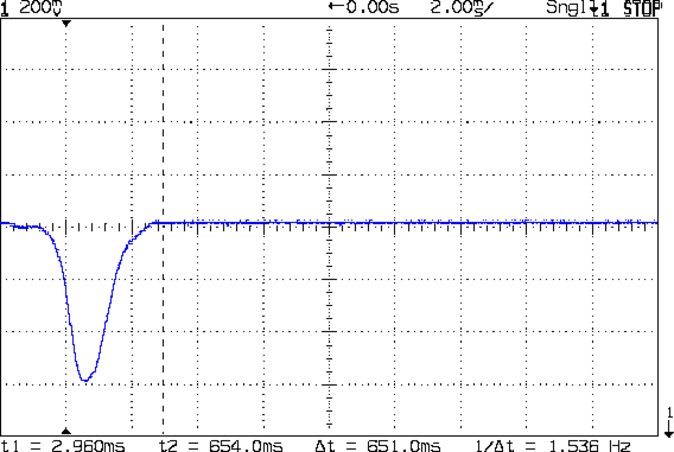
For what it’s worth, here’s a picture of the light output from the LED and Xenon flash, as captured by the 10AP photodiode aimed at the LED, with a card reflecting the flash toward the sensor:

The top trace is the beam break signal from the transconductance amp going into the Arduino. The bottom trace is the photovoltaic output of the 10AP photodiode, showing the LED and strobe flashes. The strobe delay is at 180 ms with 4 ms of relay delay compensation; dialing it back to 3 ms wouldn’t change things very much at all.