Back in 2006, I clamped a Hobo temperature sensor onto the pipe that delivers town water from the main, under 150 feet of front yard, and into our basement:
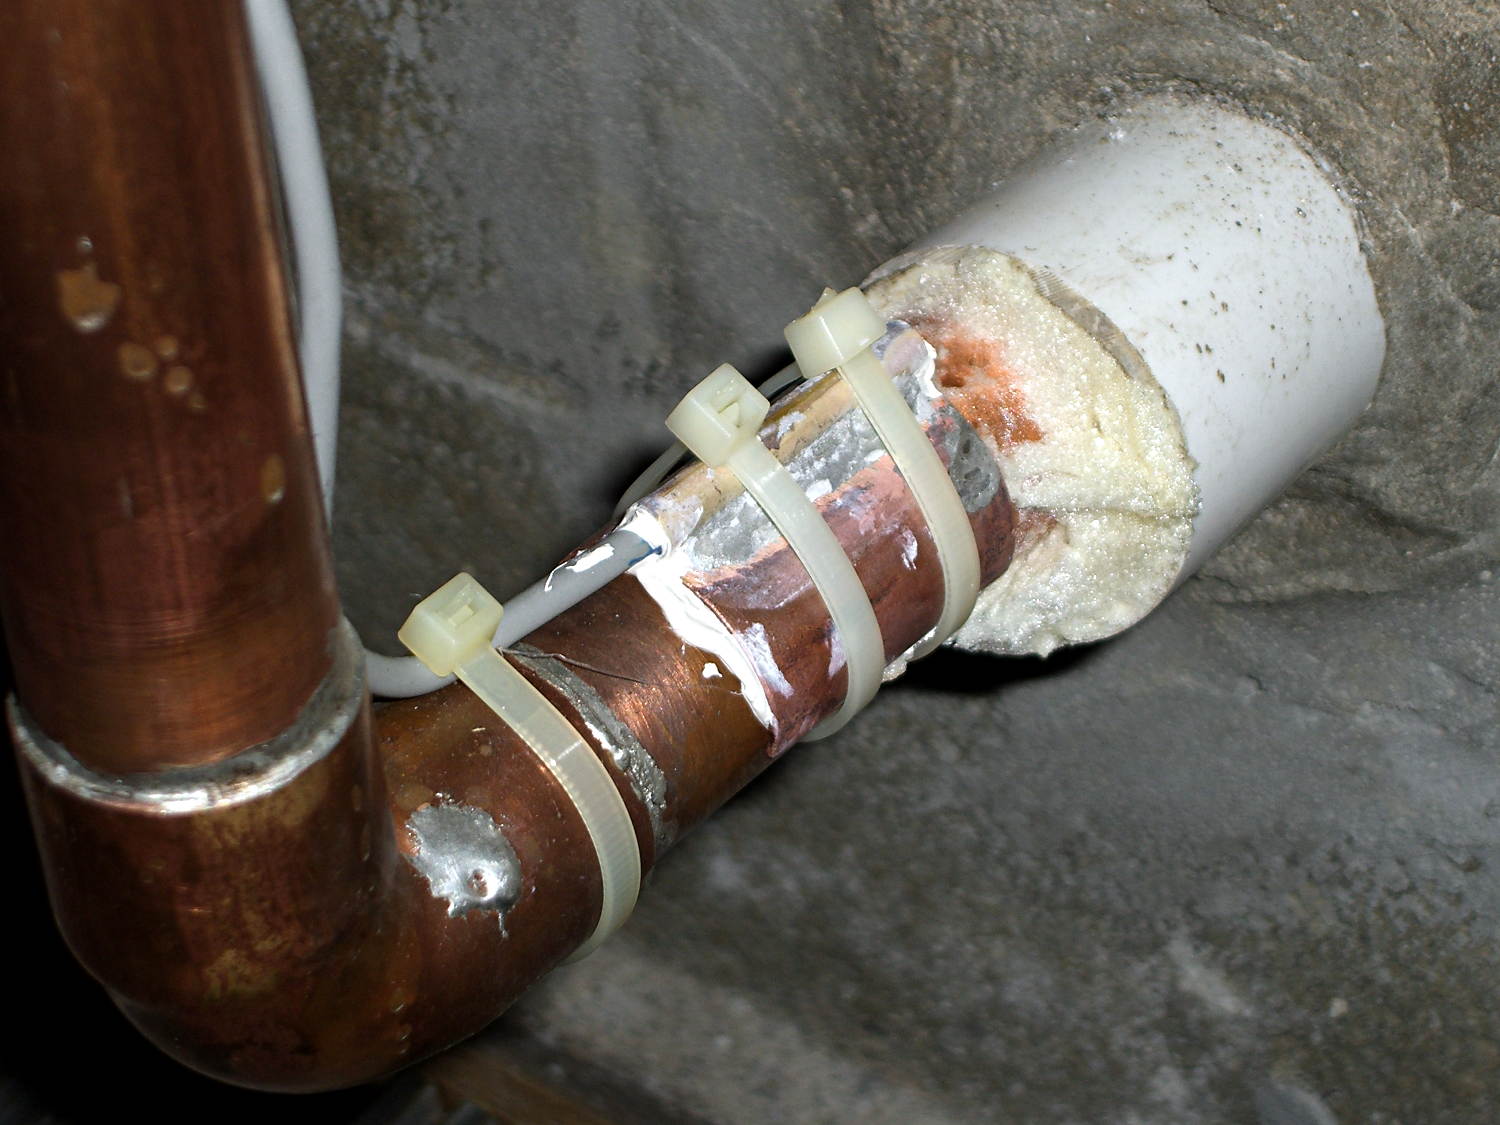
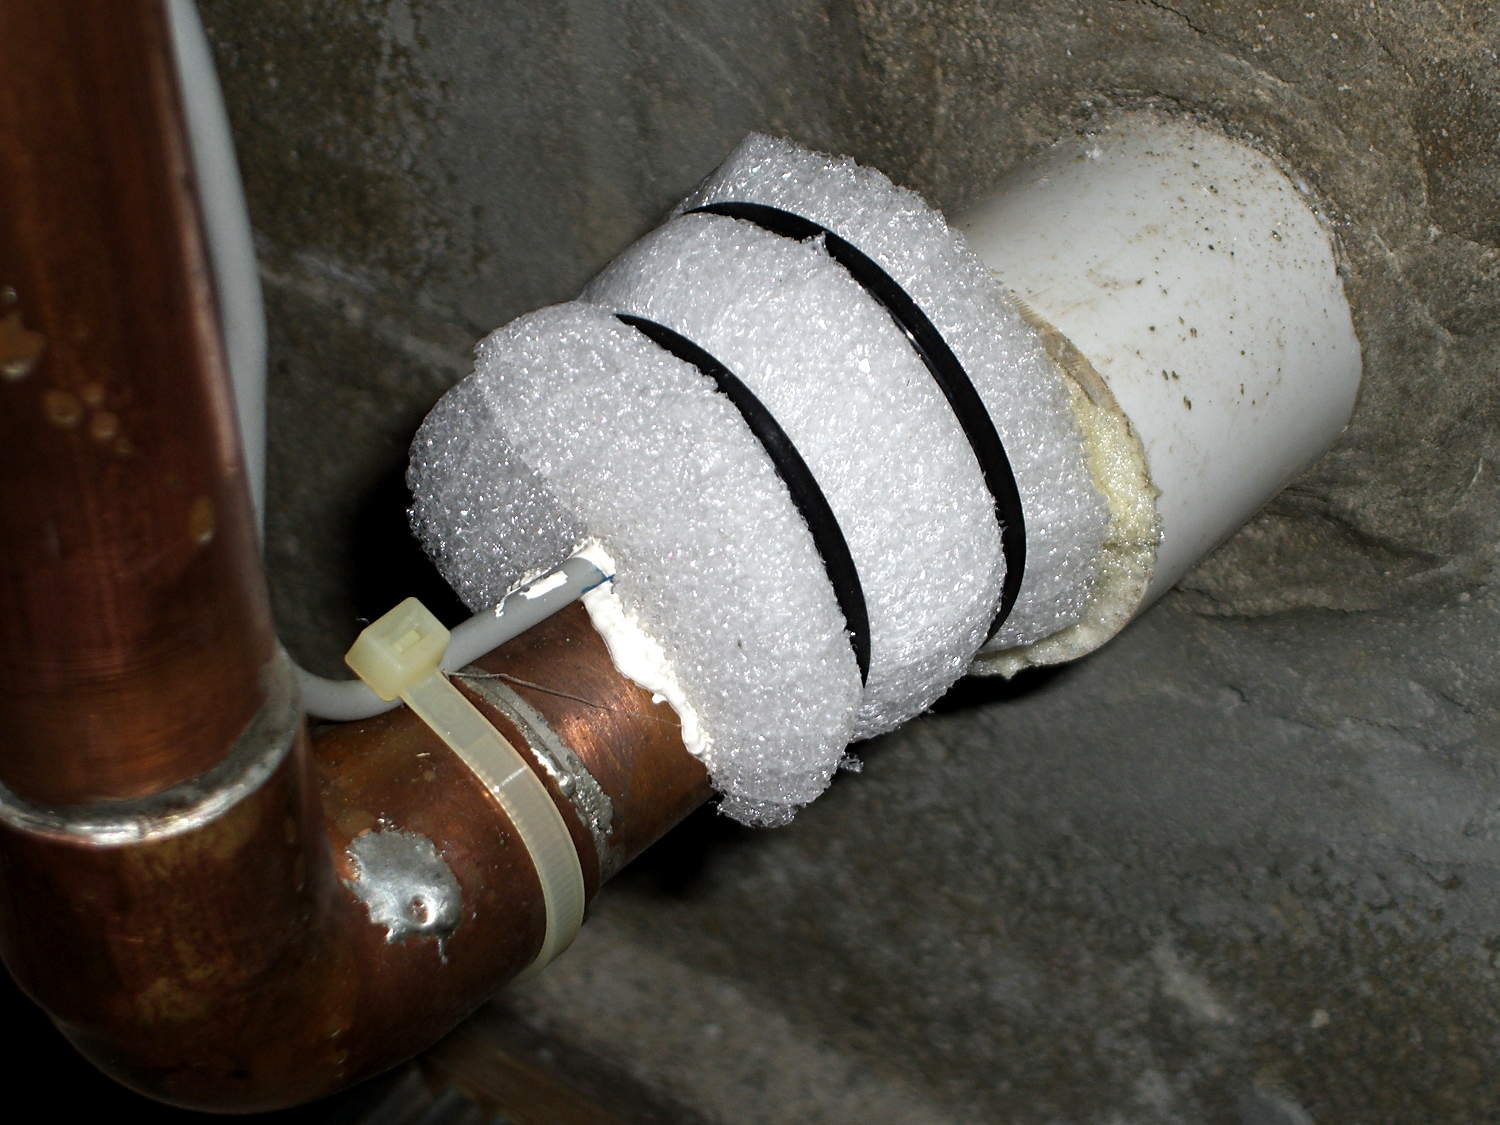
Wrapping a chunk of closed-cell foam insulation around it made me feel better, but probably doesn’t affect the results very much at all:
I assume the temperature of the pipe at that location will match the water temperature pretty closely, at least while some water flows into the house, and the water temperature will match the ground temperature four feet under the front yard.
Under those assumptions, the bottom trace shows the pipe temperature and the top trace shows the air temperature on the shelf a few feet above the pipe:
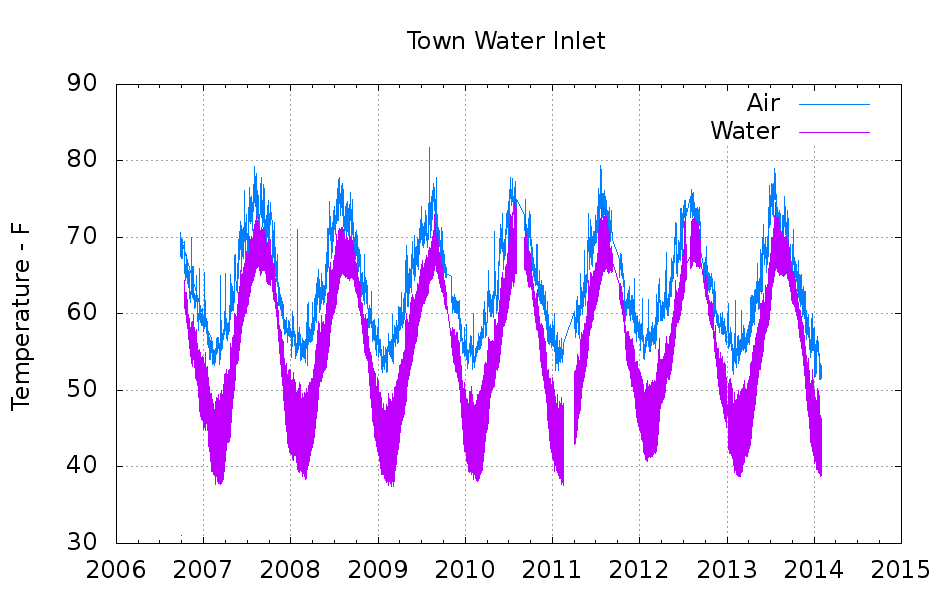
The gap in early 2011 documents an embarrassing bit of forgetfulness. All in all, you’re looking at about 750,000 logged records; if you observe something long enough, it turns into science.
Cleaning up the date and time columns in the data files required a few hours of heads-down sed experimentation:
- Convert quoted headers to comments →
s/^\"/#&/ - Convert non-data records to comments →
s/^.*Logged/#&/ - Convert two-digit years to four-digit years and enforce trailing blank →
s_/\([01][0-9]\)[ ,]_/20\1 _ - Enforce blank after four-digit years →
s_/\(20[0-9]\{2\}\),_/\1 _ - Remove blank after time-of-day value →
s_\(:[0-9]\{2\}\) _\1_
Being reminded that sed will accept (nearly) any delimiter character came in handy!
The temperature spikes happen when I bring the Hobo datalogger upstairs to read it out. The plotting routine discards the junk readings caused by unplugging the remote sensor; anything below 30 °F or above 100 °F counts as spurious. The gnuplot idiom uses the ternary operator with the Not-a-Number value:
plot "filename" using 2:((\$3 > 30) && (\$3 < 100) ? \$3 : NaN) with ...</code>
The backslashes escape gnuplot’s variable markers, which would otherwise get eaten by Bash.
The Bash / gnuplot script that produces the plot:
#!/bin/sh
#-- overhead
export GDFONTPATH="/usr/share/fonts/truetype/"
base="${1%.*}"
echo Base name: ${base}
tfile1=$(tempfile)
ofile=${base}.png
echo Input file: $1
echo Temporary files: ${tfile1}
echo Output file: ${ofile}
#-- prepare csv Hobo logger file
sed 's/^\"/#&/ ; s/^.*Logged/#&/ ; s_/\([01][0-9]\)[ ,]_/20\1 _ ; s_/\(20[0-9]\{2\}\),_/\1 _ ; s_\(:[0-9]\{2\}\) _\1_' "$1" > ${tfile1}
#-- do it
gnuplot << EOF
set term png font "arialbd.ttf" 18 size 950,600
set output "${ofile}"
set title "${base}"
set key noautotitles
unset mouse
set grid xtics ytics
set timefmt "%m/%d/%Y %H:%M:%S"
set xdata time
#set xlabel "Week of Year"
set format x "%Y"
set ylabel "Temperature - F"
set yrange [30:90]
set datafile separator ","
plot	\
    "${tfile1}" using 2:((\$3 > 30) && (\$3 < 100) ? \$3 : NaN) with lines lt 3 title "Air", \
    "${tfile1}" using 2:((\$5 > 30) && (\$5 < 100) ? \$5 : NaN) with lines lt 4 title "Water"
EOF

Comments
6 responses to “Monthly Science: Town Water Inlet Temperature”
A one year moving average might be interesting to see.
Now that I can automagically clean up the datasets, it’s possible to think about presentation… [grin]
“Wrapping a chunk of closed-cell foam insulation around it made me feel better, but probably doesn’t affect the results very much at all”
Years ago did a contract for Fuel Computer Corporation in NYC. They were using a copper pipe about 2 meters long that was mounted vertically on the outside to attempt to match the weather service reading. The pipe was hollow, but once stuffed with insulation, the readings correlated with the official reports. With one of these on each corner of an apartment building, we were are to accurately guess the time on sunny days.
I stuffed a remote temperature transmitter under the squirrel deterrent bucket under the seed feeder, where it comes surprisingly close to the NWS data from the airport. It’s much closer than the sensor dangling below a south window near the dark brown siding, anyway… [grin]
I don’t even try. The NWS station is 25 miles away and buffered by a lake effect from Upper Klamath Lake. We’re in a river valley, so we get colder nights and warmer days (usually), but going from the barn to the house, I note that the creekbed area is several degrees colder than the ridges. We use the “front porch standard temperature”. Close enough.
A common effect around here: the entire Hudson River channel filled with dense fog, right up to the level of the hills along the shoreline, as though somebody laid a strip of cotton batting over the water. A wonder to behold!