Ed Nisley's Blog: Shop notes, electronics, firmware, machinery, 3D printing, laser cuttery, and curiosities. Contents: 100% human thinking, 0% AI slop.
Category: Science
If you measure something often enough, it becomes science
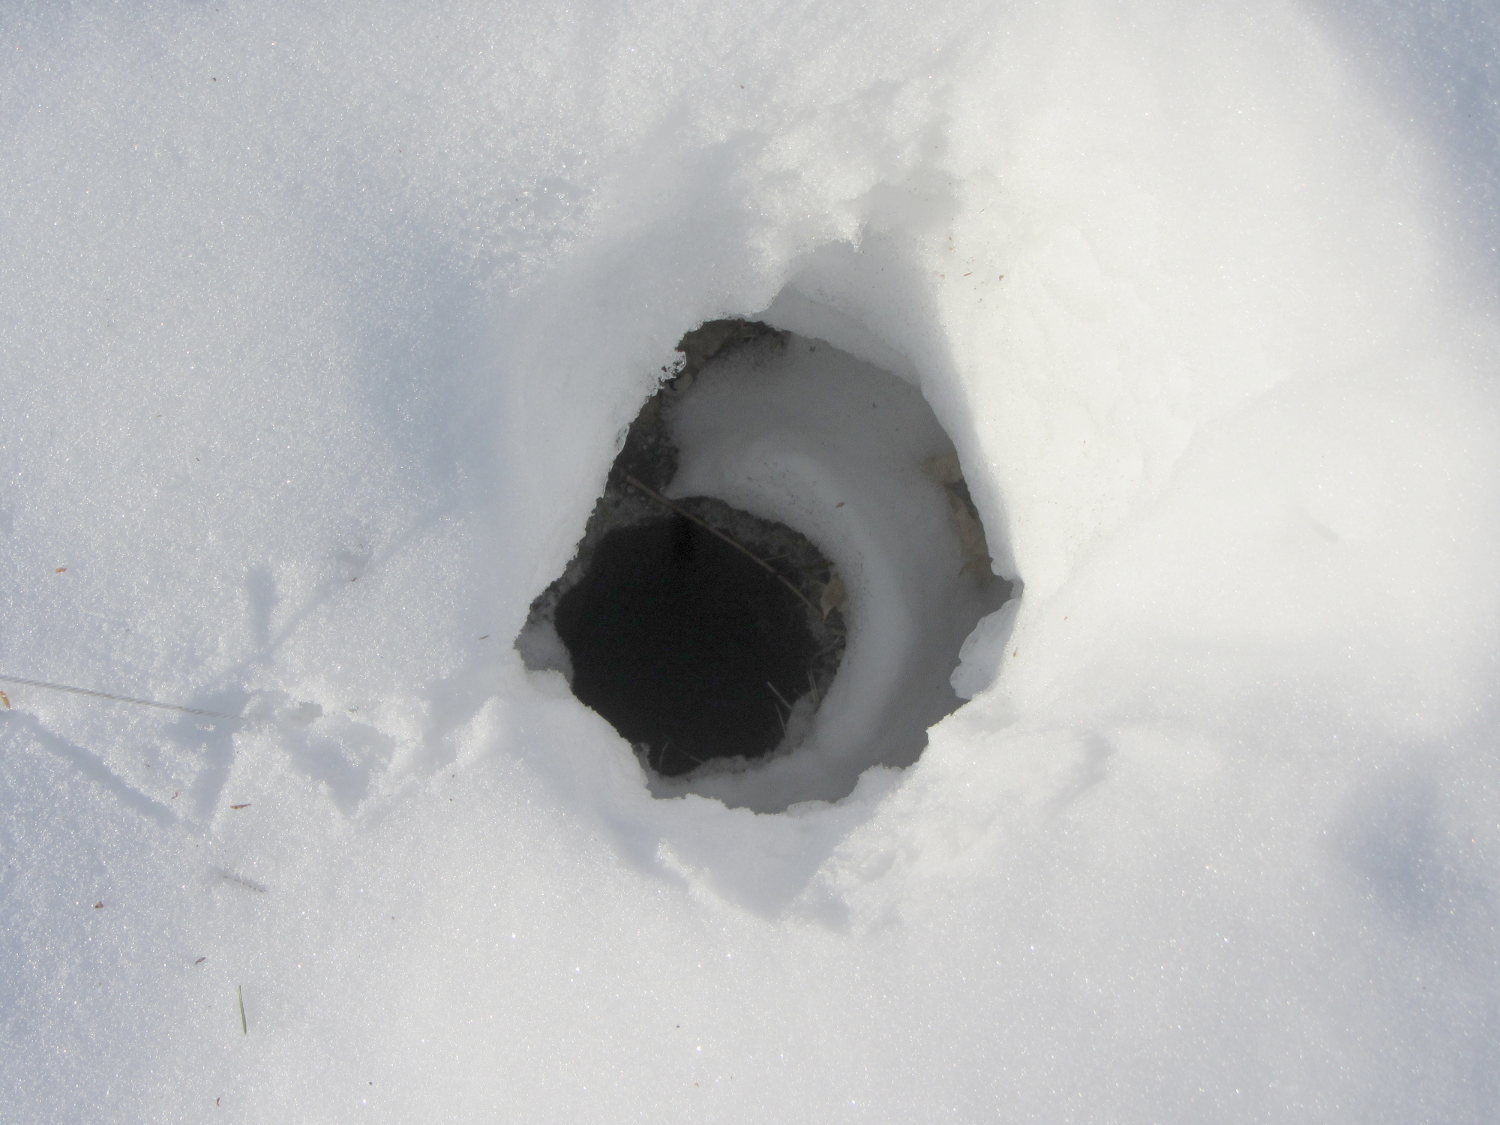
The well pit has two vent holes made from old-school fluted steel downspout pipe embedded vertically in a half-foot concrete slab. They’re maybe five feet apart and the southwest hole seems to be the air inlet:
Well Pit – SW vent
The northeast hole must be the outlet for all that ground-warmed air:
Well Pit – NE vent
The logger hangs from the string entering from the center left, with a ring hung over an abandoned hose bib rising straight out of the concrete.
Surely it’s been that cold before without freezing the pipes, so I won’t worry too much…
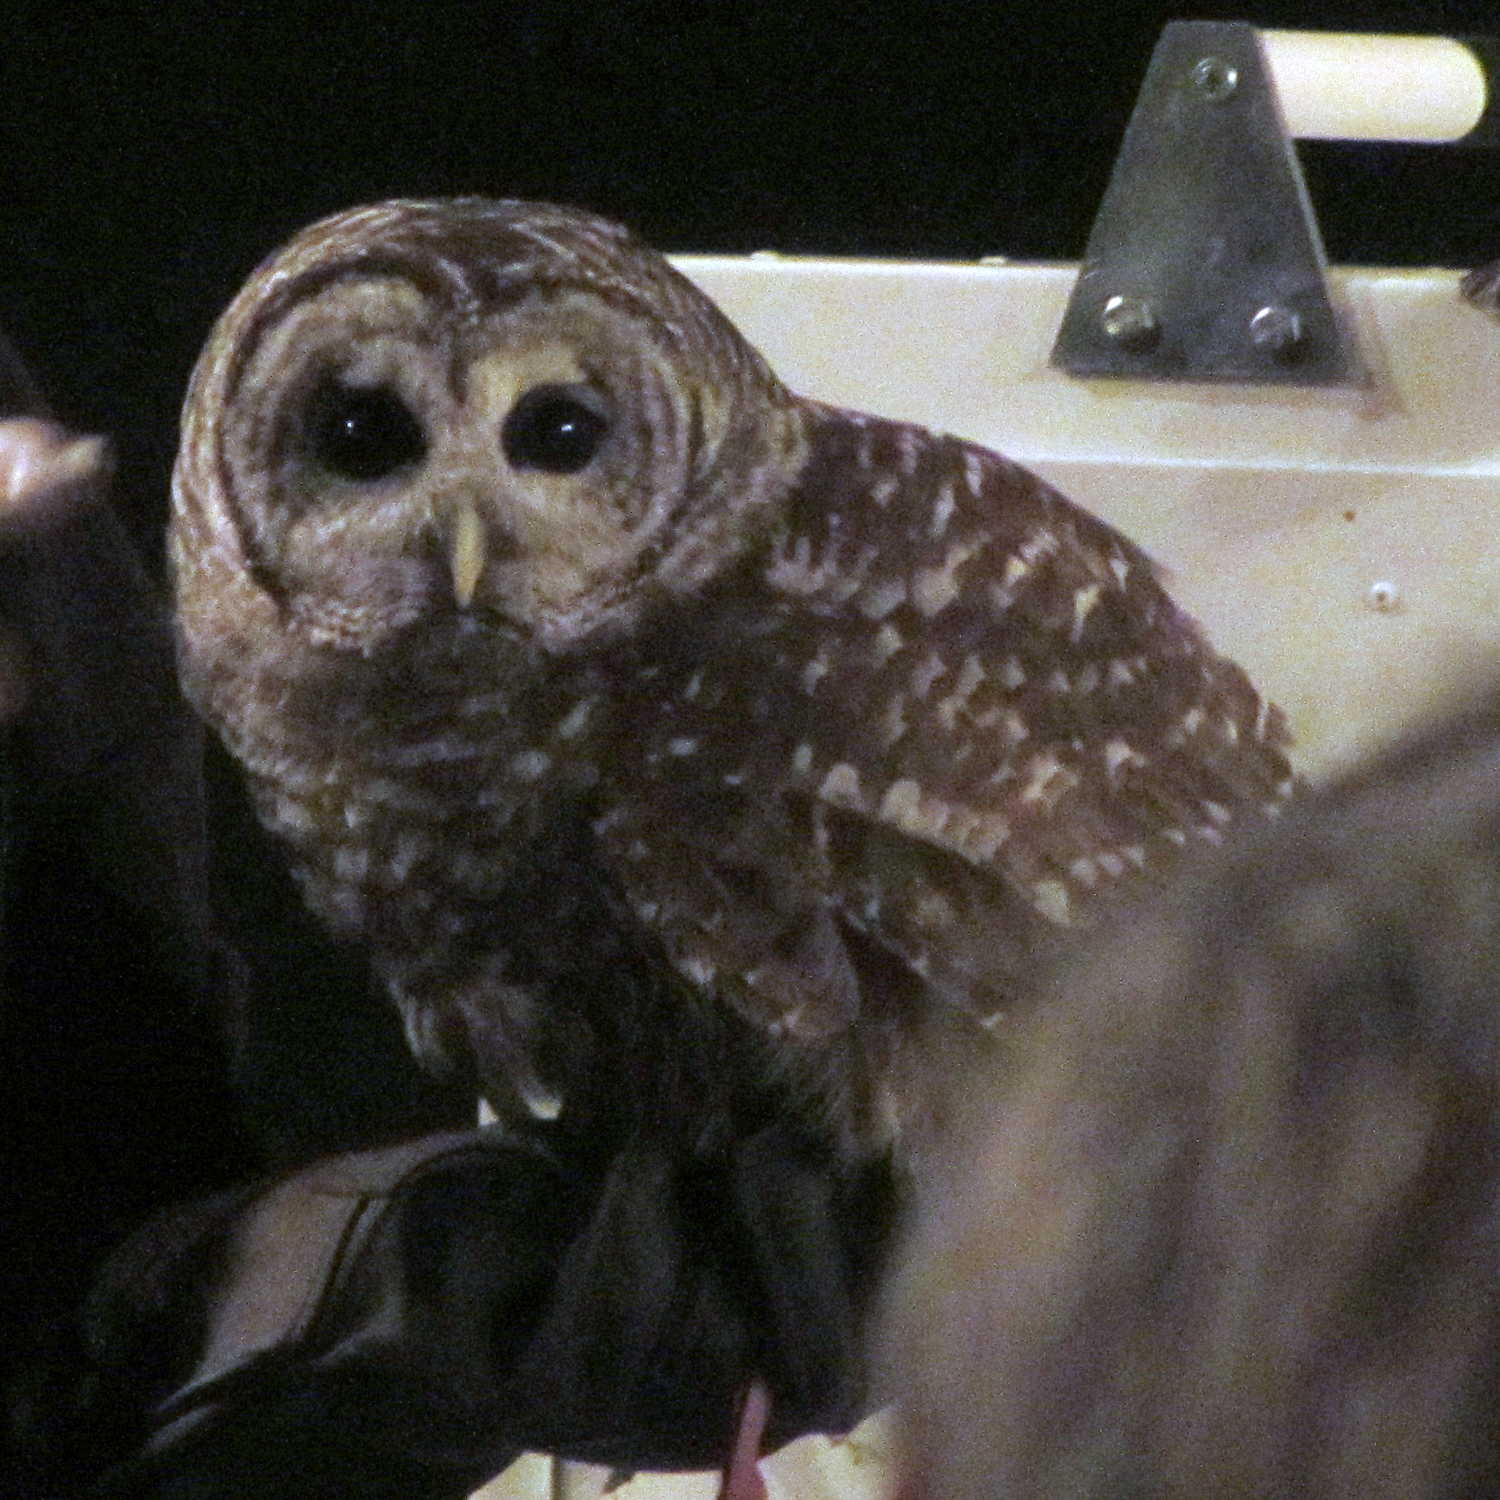
A licensed bird rescuer gave a talk before a showing of Pelican Dreams in Rhinebck and presented some of her patients…
A Red Tailed Hawk with a broken left wing, just out of its bandage:
Red Tailed Hawk – in hand
A Barred Owl who, despite having a left eye that no longer dilates, rapidly acquired weapons lock on my camera’s focus assist light:
Barred owl – eye contact
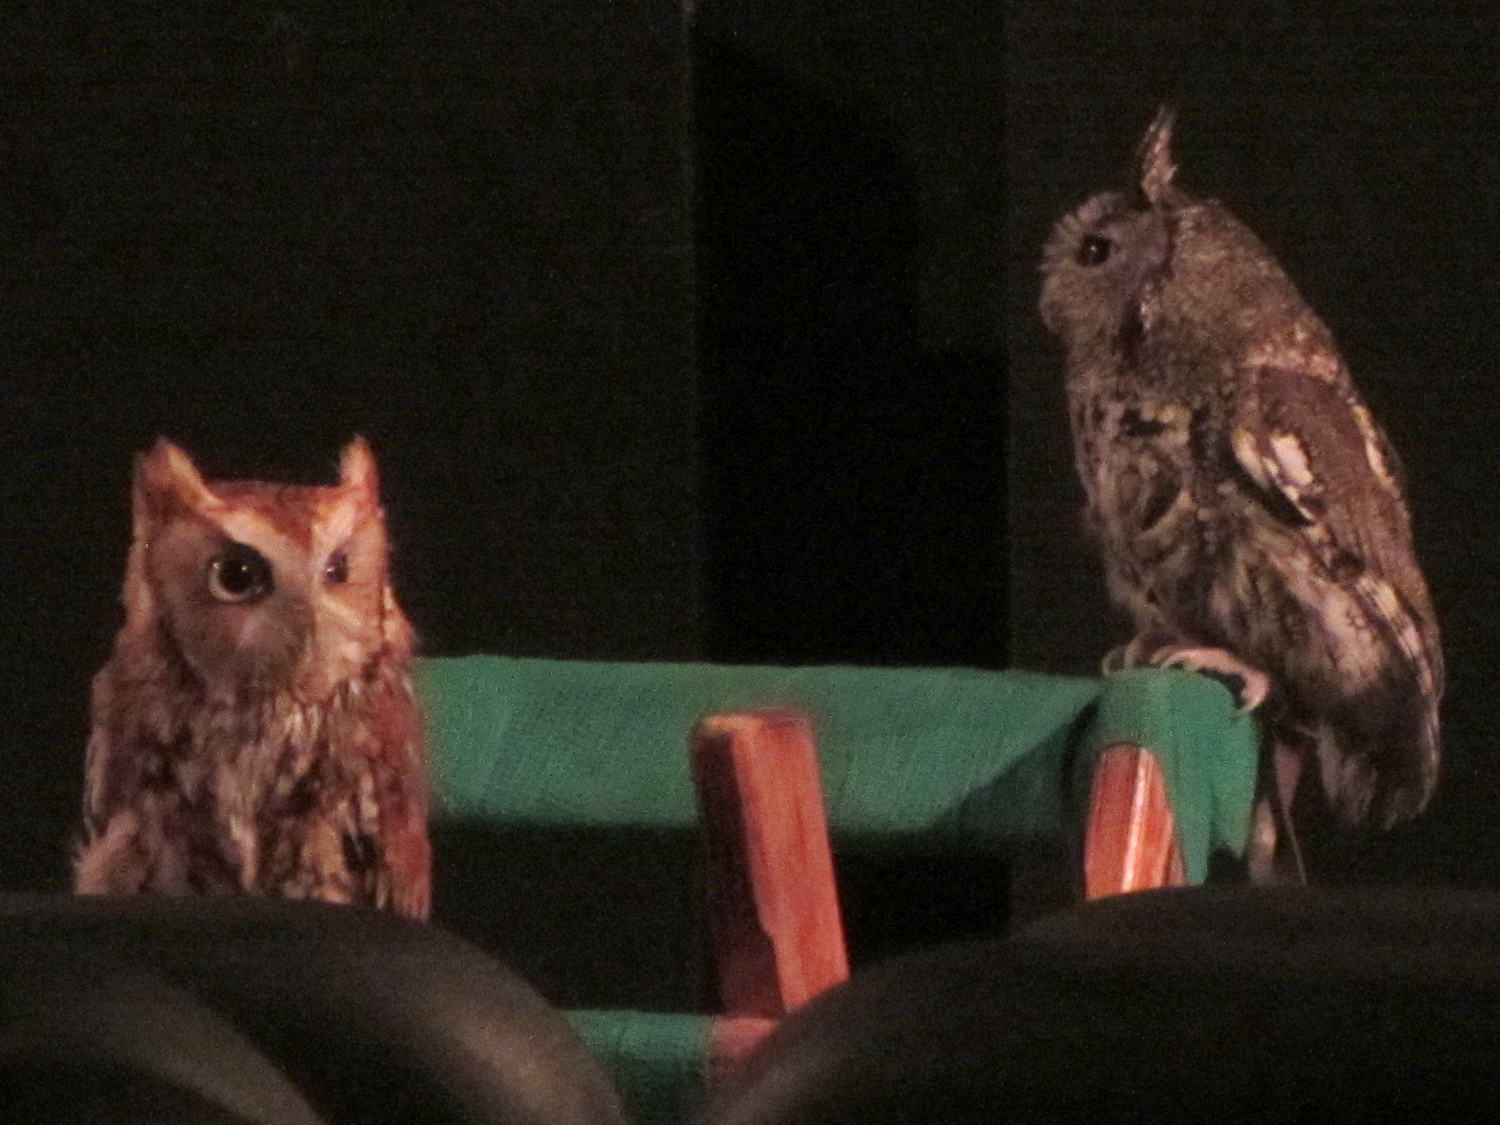
And a pair of insanely cute Screech Owls, both with eye damage, atop their padded perch:
Screech Owls – on stand
Most of her patients arrive after collisions with automobiles; it seems carnivorous birds don’t look both ways before pouncing on prey near the roadside.
Contrary to her impassioned claims, however, wind turbines kill essentially zero birds, at least compared to windows, HV power lines, and cats. Some reports with actual numbers that, obviously, won’t convince anybody who already knows what the results should be:
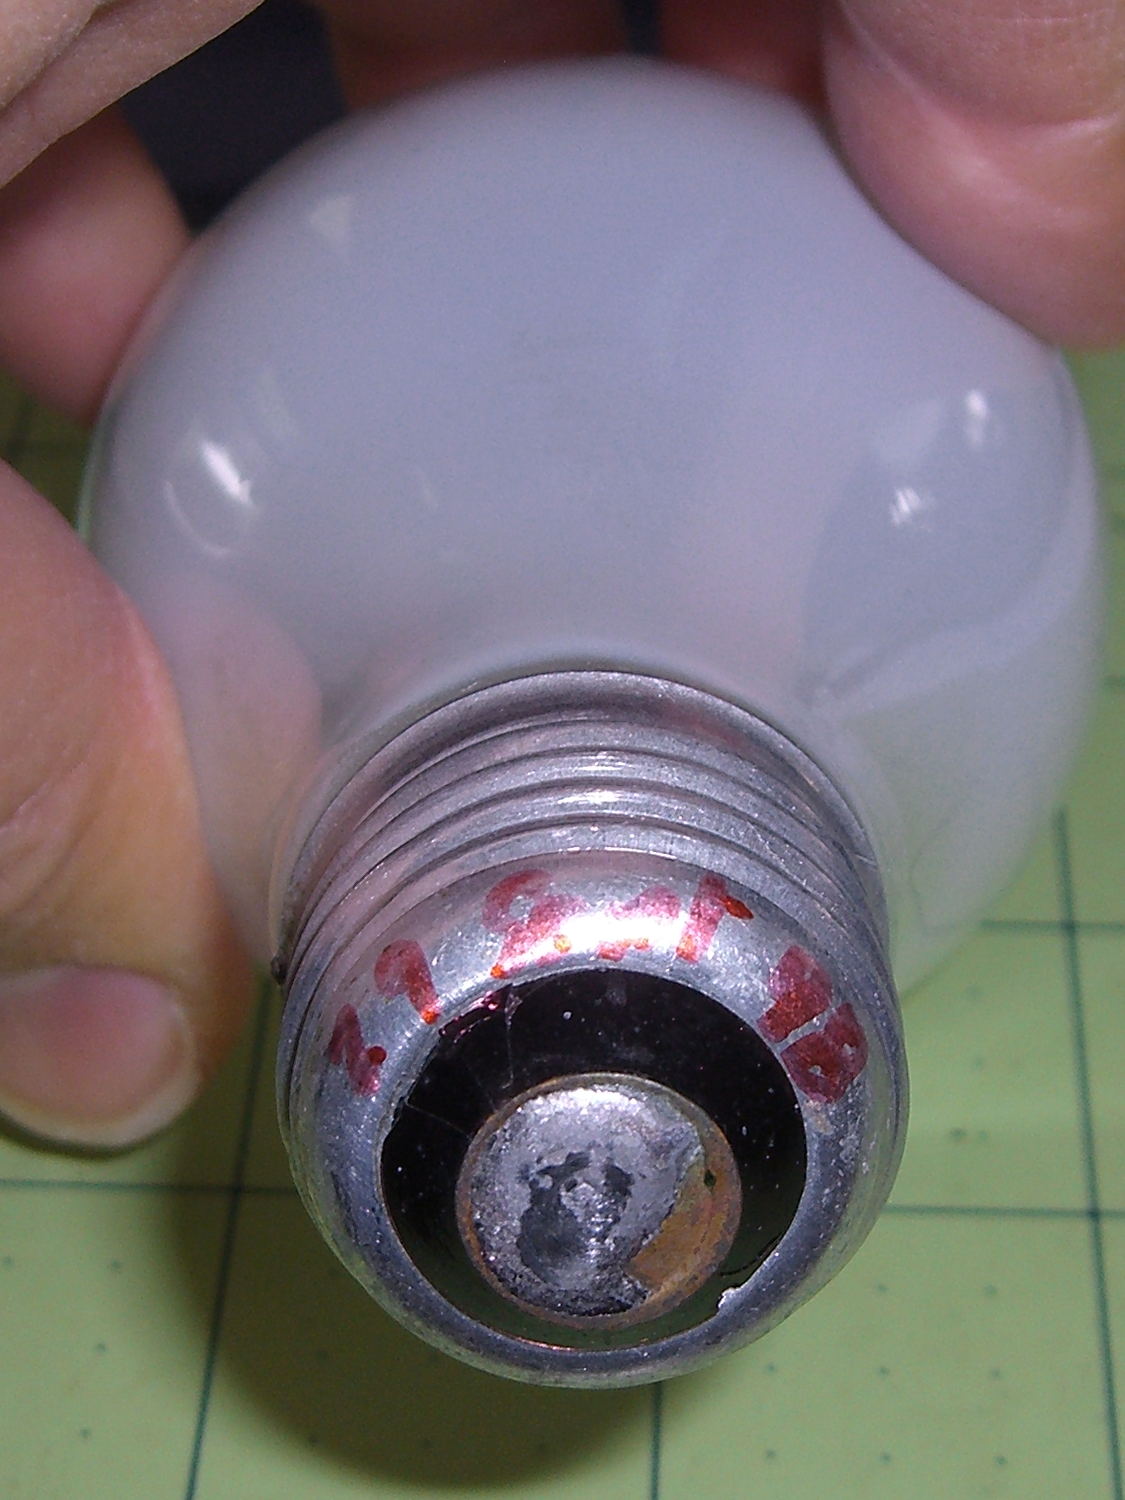
One of the four 40 W bulbs in the classic 1955 fixture over the front bathroom mirror burned out, leading to this discovery:
40 W bulb – lifetime
Yup, I installed that bulb in late September 1998, when we repainted that bathroom (for the first time since the original owners painted it in 1955). Getting a decade and a half from an incandescent bulb in regular use ain’t all that bad, sez I. Two other bulbs appeared in mid 2014, replacing bulbs with barely 6 years of service. Inexplicably, the third bulb has no date; I must be slipping.
Having burned through the 40 W bulb stash, I put two 60 W incandescents in the center sockets, leaving me with four new-old-stock bulbs on the shelf. Might be a lifetime supply for this house…
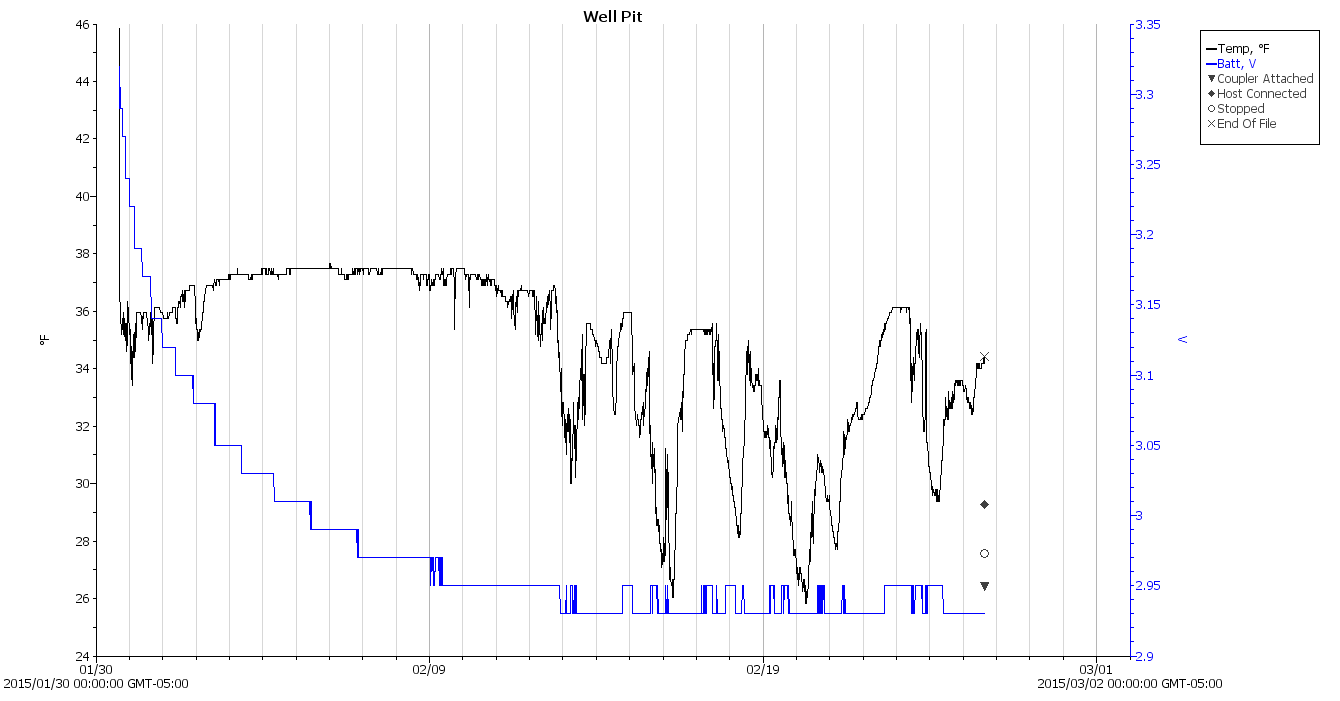
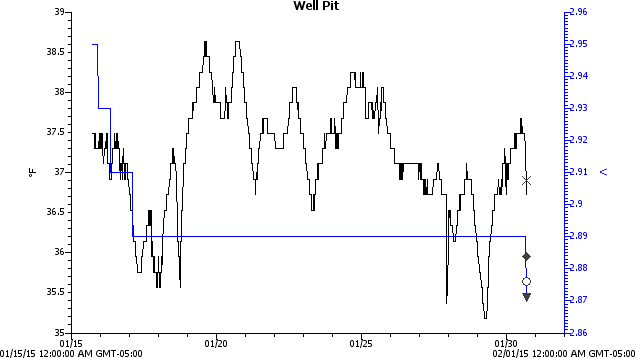
From a datalogger hanging on a string in the well pit, about three feet underground, in December:
Well Pit – 2014-12 – min size
The temperatures continue downward in January:
Well Pit – 2015-01 – min size
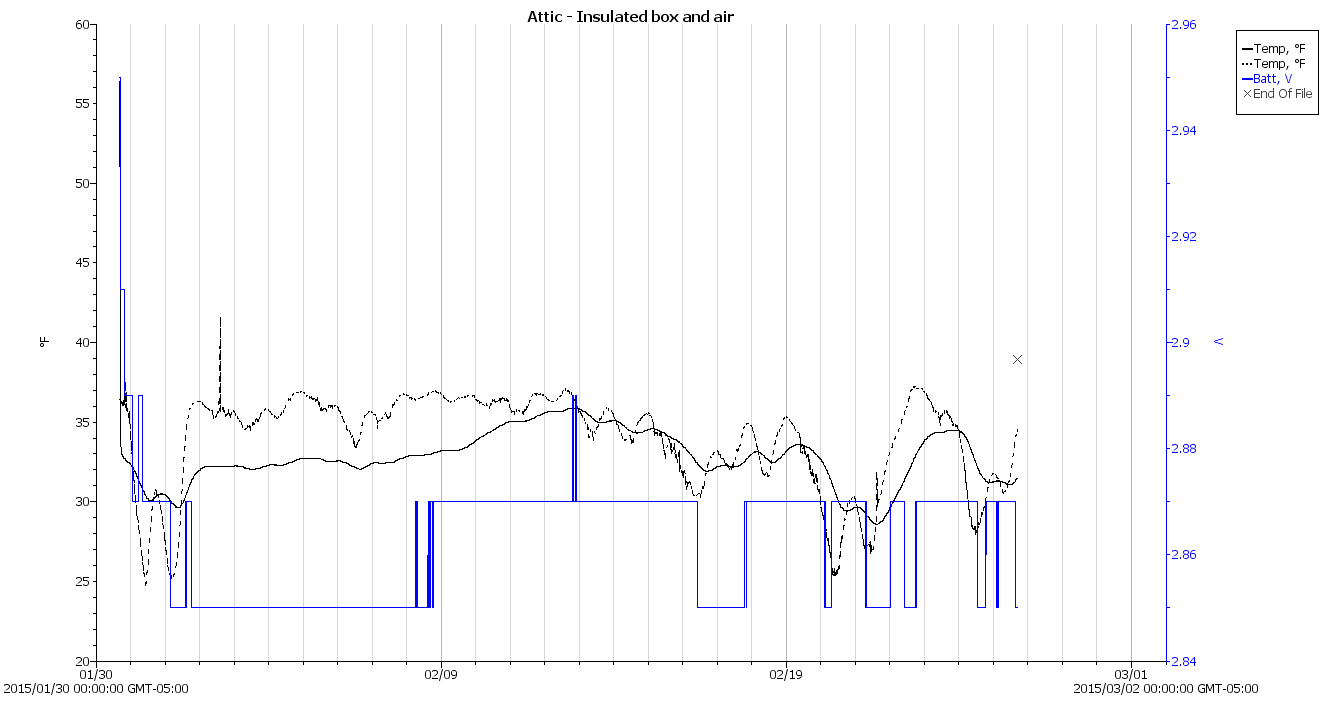
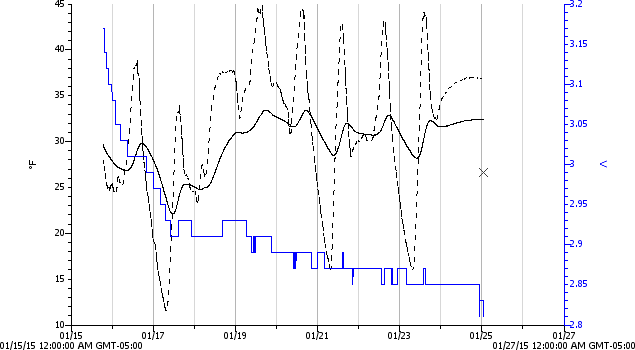
The corresponding attic air temperature record for January ends early:
Attic – Insulated Box – Maxell battery failure
When the air temperature dropped to +11 °F in the early hours of 17 January 2015, the well pit hit 35.5 °F. It was just over 35 °F in the wee hours of 29 January 2015, but the attic logger gave up as the battery voltage declined to 2.8 V.
Evidently, the new Maxell CR2032 lithium cells don’t do well in extreme cold. They’re rated to -20 °C = -4 °F, but that spec applies for a very low load that surely doesn’t include blinking a red LED.
I’ll take a look at that logger in a few days, then hack a pair of AA cells on the back if it’s dead again. Alkaline cells aren’t very good in cold weather, either, but they may have a better minimum voltage.
I ran across your blog on Smart Beaconing and saw something that needed correction.
You state the Turn Slope is in units Degrees / MPH
This is incorrect. Although the term Turn Slope is not a real slope (such as rise/run classically) that is what the originators used albeit incorrectly. They do however correctly attribute the units to MPH * Degrees (a product and hence not really a slope).
In their formula they calculate a turn threshold as:
turn_threshold = min_turn_angle + turn_slope / speed
Looking at the units we see:
= Degrees + (MPH * Degrees) / MPH
which yields
= Degrees + Degrees
Which makes sense. It is too bad that the originators used the wrong term of Turn Slope which confuses most people. A better term would have been Turn Product.
In looking back over that post, I have no idea where or how I got the wrong units, other than by the plain reading of the “variable name”.
As he explained in a followup note:
As for units… I was introduced to making unit balance way back in 1967-1968 science class in HS by a really fine science teacher. It has served me all my life and I’m thankful for that training.
I have ever since told that teacher so!
A while back, our Larval Engineer rammed an engineering physics class head-on and sent me a meme image, observing that I’d trained her well: if the units don’t work out, then you’re doing it wrong.
Our Larval Engineer volunteered to convert the lens from a defunct magnifying desk lamp into a hand-held magnifier; there’s more to that story than is relevant here. I bulldozed her into making a solid model of the lens before starting on the hand-holdable design, thus providing a Thing to contemplate while working out the holder details.
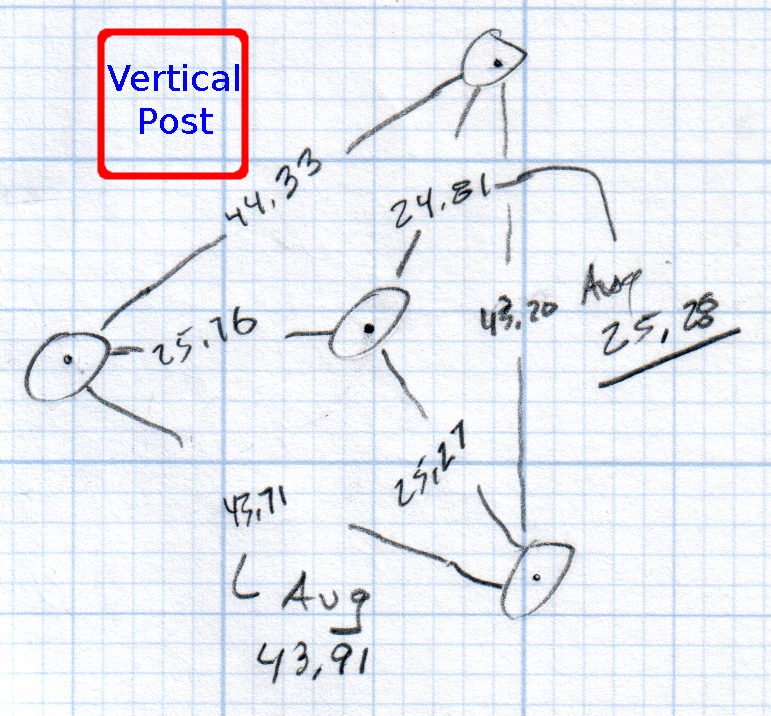
That justified excavating a spherometer from the heap to determine the radius of curvature for the lens:
Student Sphereometer on lens
You must know either the average radius / diameter of the pins or the average pin-to-pin distance. We used a quick-and-dirty measurement for the radius, but after things settled down, I used a slightly more rigorous approach. Spotting the pins on carbon paper (!) produced these numbers:
Sphereometer Pin Radii
The vertical scale has hard-metric divisions: 1 mm on the post and 0.01 on the dial. You’d therefore expect the pins to be a hard metric distance apart, but the 25.28 mm average radius suggests a crappy hard-inch layout. It was, of course, a long-ago surplus find without provenance.
The 43.91 mm average pin-to-pin distance works out to a 50.7 mm bolt circle diameter = 25.35 mm radius, which is kinda-sorta close to the 25.28 mm average radius. I suppose averaging the averages would slightly improve things, but …
The vertical distance for the lens in question was 0.90 mm, at least for our purposes. That’s the sagitta, which sounds cool enough to justify this whole exercise right there. It’s 100 mm in diameter and the ground edge is 2.8 mm thick, although the latter is subject to some debate.
Using the BCD, the chord equation applies:
Height m = 0.90 mm
Base c = 50.7 mm
Lens radius r = (m2 + c2/4) / 2m = 357.46 mm
Using the pin-to-pin distance, the spherometer equation applies:
Pin-to-pin a = 43.91 mm
Sagitta h = 0.90 mm
Lens radius R = (h/2) + (a2 / 6h) = 357.50 mm
Close enough, methinks.
Solving the chord equation for the total height of each convex side above the edge:
Base c = 100 mm
Lens radius r = 357.5 mm
Height m = r – sqrt(r2 -c2/4) = 3.5 mm
So the whole lens should be 2 · 3.5 + 2.8 = 9.8 mm thick. It’s actually 10.15 mm, which says they were probably trying for 10.0 mm and I’m measuring the edge thickness wrong.
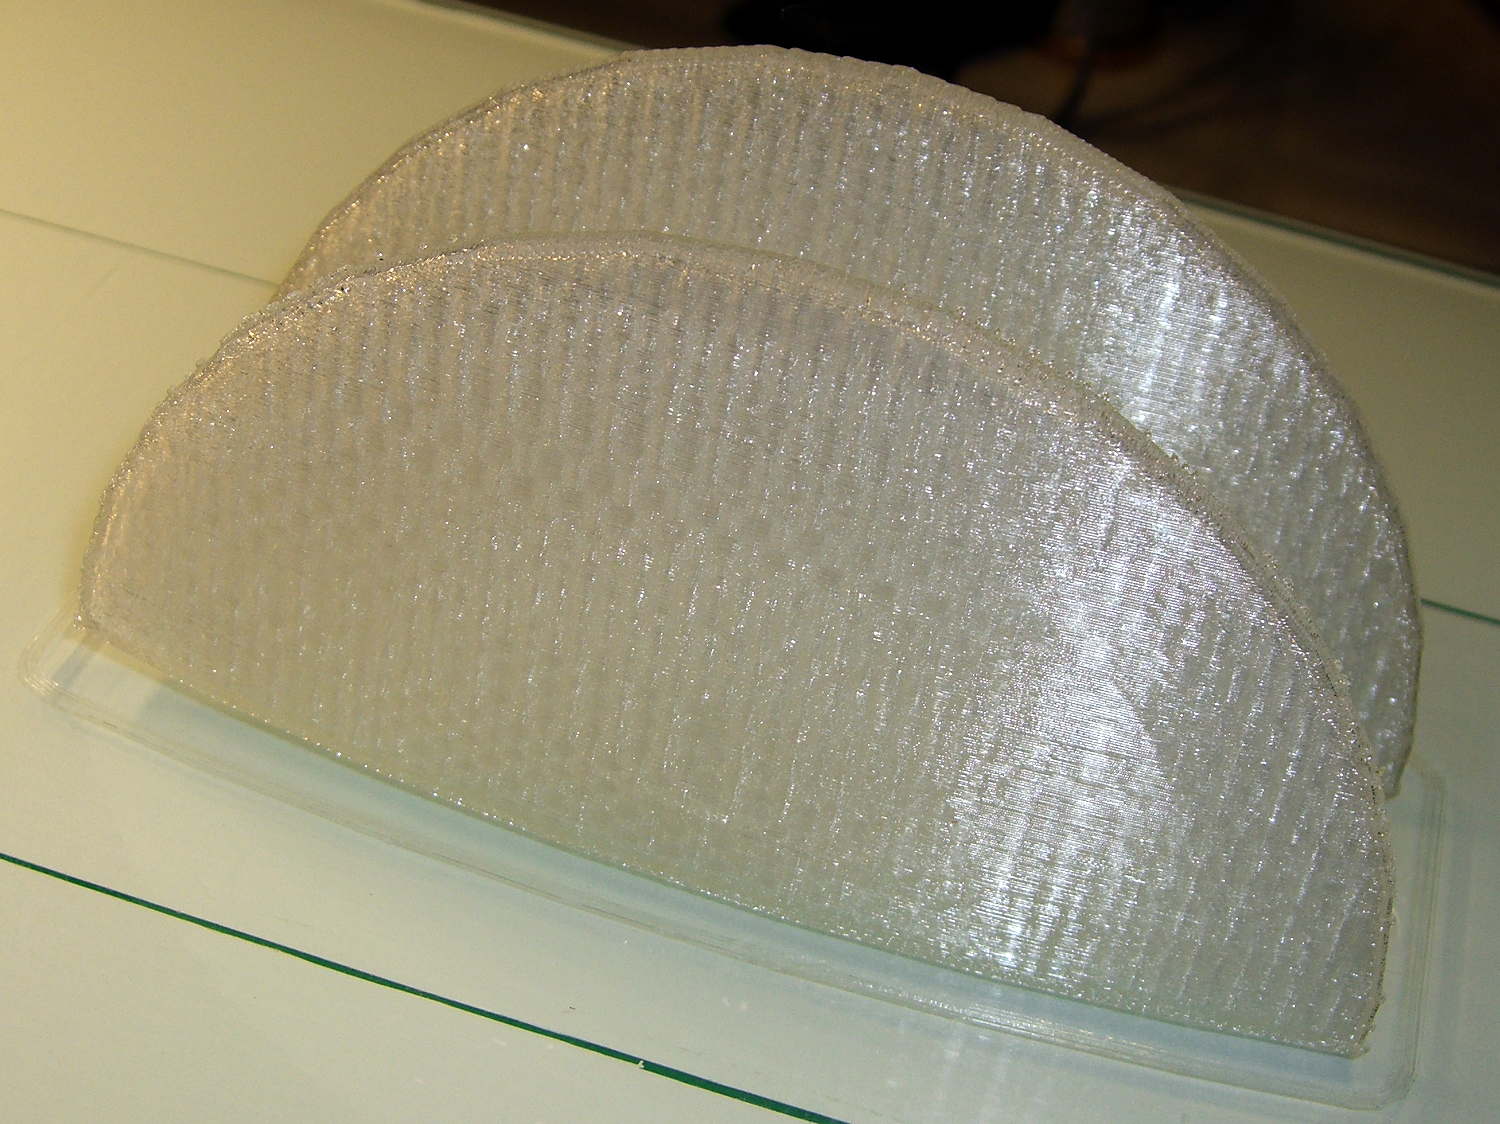
She submitted to all this nonsense with good grace and cooked up an OpenSCAD model that prints the “lens” in two halves:
Printed Lens – halves on platform
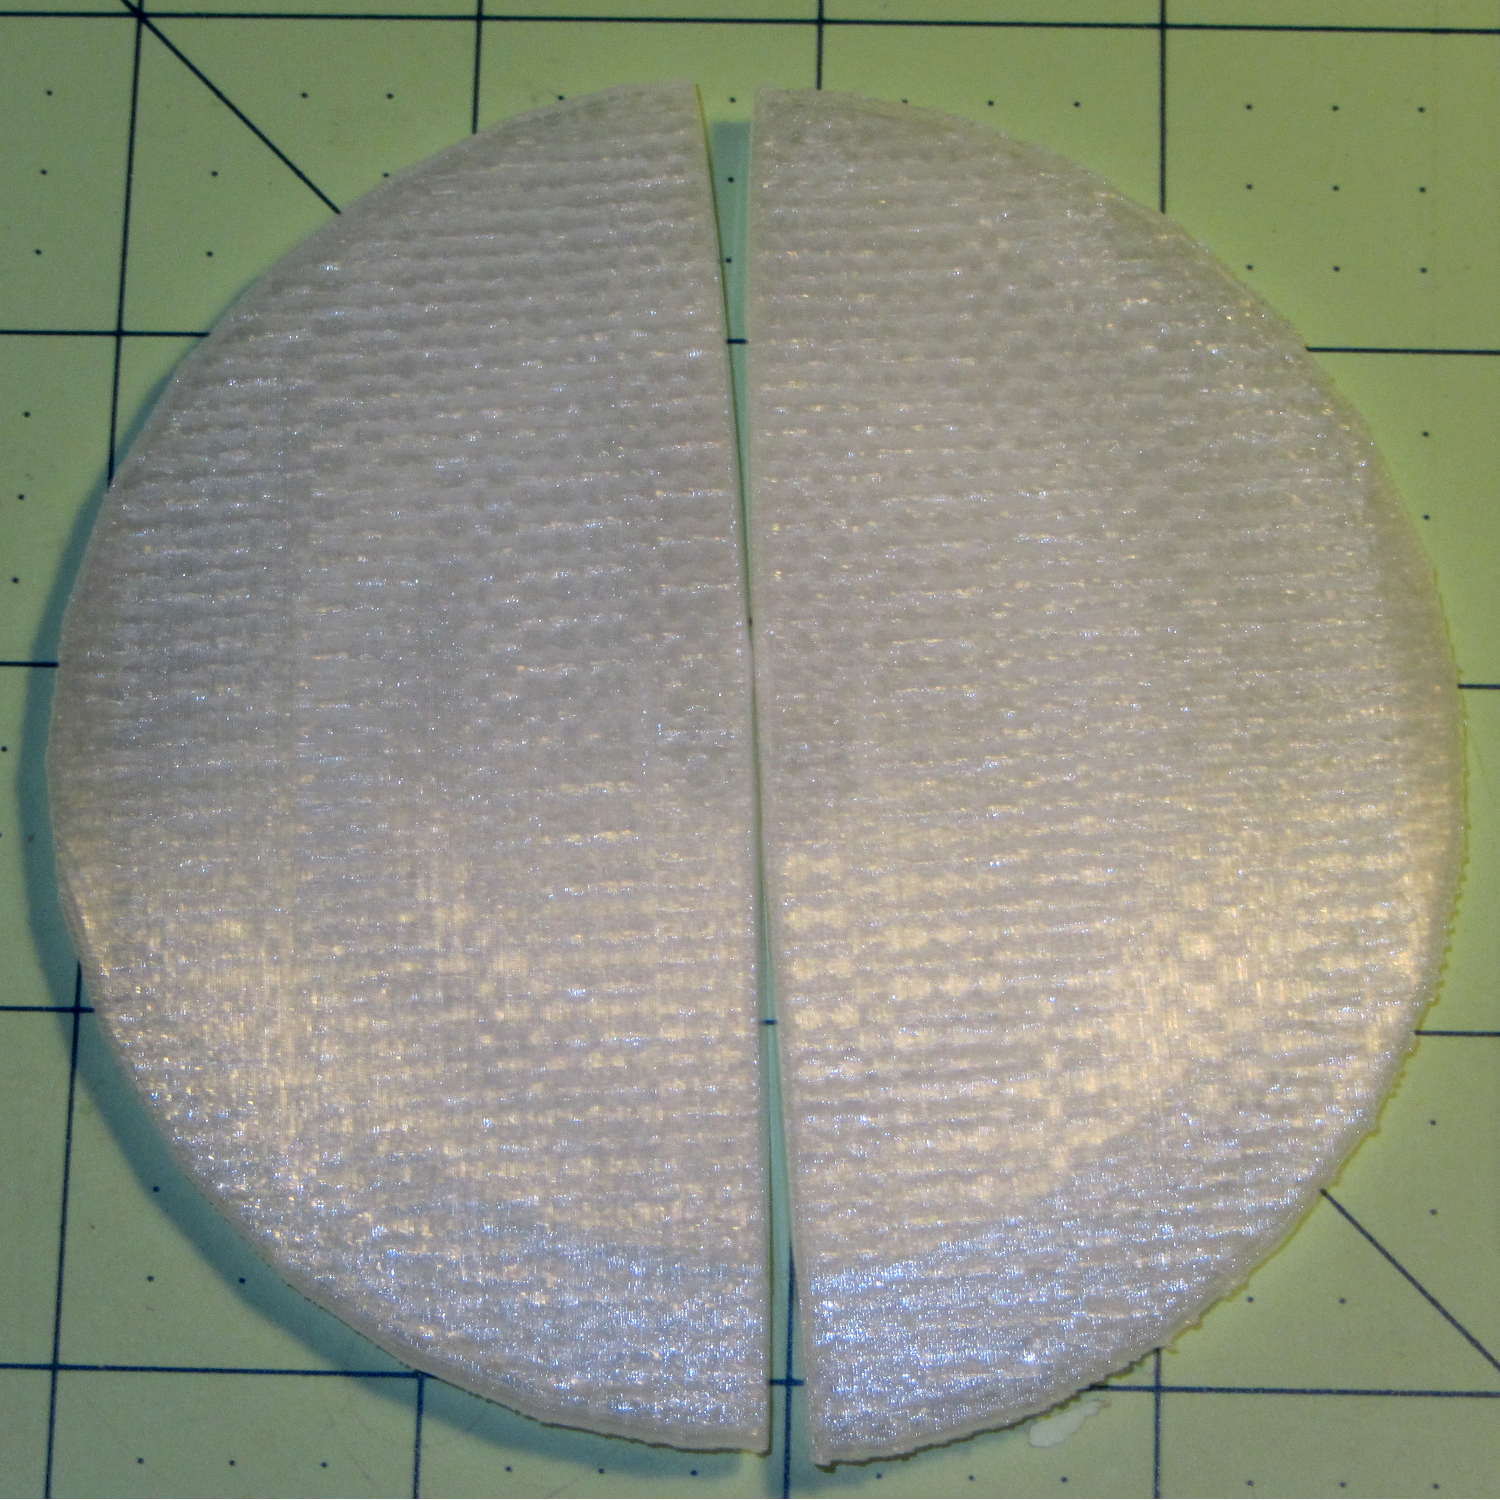
Alas, those thin flanges have too little area on the platform to resist the contraction of the plastic above, so they didn’t fit together very well at all:
Printed Lens – base distortion
We figured a large brim would solve that problem, but then it was time for her to return to the hot, fast core of college life…