Ed Nisley's Blog: Shop notes, electronics, firmware, machinery, 3D printing, laser cuttery, and curiosities. Contents: 100% human thinking, 0% AI slop.
Category: Science
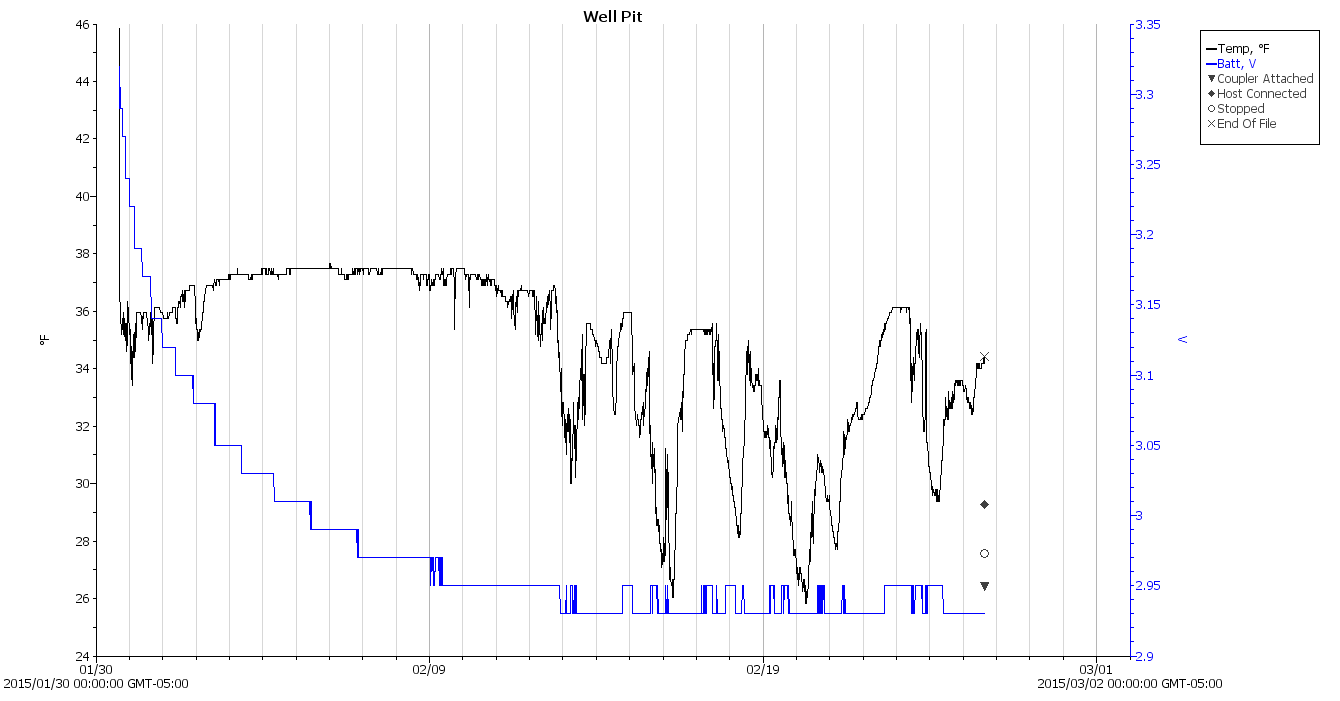
If you measure something often enough, it becomes science
I’d say the air temperature in the pit got close to freezing, but surely a stream of cold air falling through the vent hole would wash over the logger and depress the results.
Should I get powerfully motivated, I’ll strap the logger onto one of the pipes, wrap insulation around it, and have it take data from early December through late March in one session; lifting the concrete slab requires enough effort that I’m not going to do it, ah, lightly during the snow season.
We recently watched a gray squirrel drag a completely limp and unresponsive companion across the driveway, stopping every few yards to rest. We often see pairs of squirrels frisking / chasing / tussling in the yard, but this was something new.
After 100 feet of dragging, with pauses every few yards, the squirrel had hauled her companion to the fence at the far side of the yard. I leaped to the conclusion that the limp squirrel was dead:
Mother squirrel and pup – 1
But, after perhaps a minute, the “dead” squirrel gradually awoke and both critters slowly clambered up the fence. The squirrel on the right had been doing the dragging and is unquestionably female, the one on the left is much smaller and likely a new pup:
Mother squirrel and pup – 2
So apparently the mother squirrel had hauled one of her pups away from something. Perhaps it was stunned after falling out of a tree or the sole survivor of a hawk attack? We’ll never know The Rest of The Story.
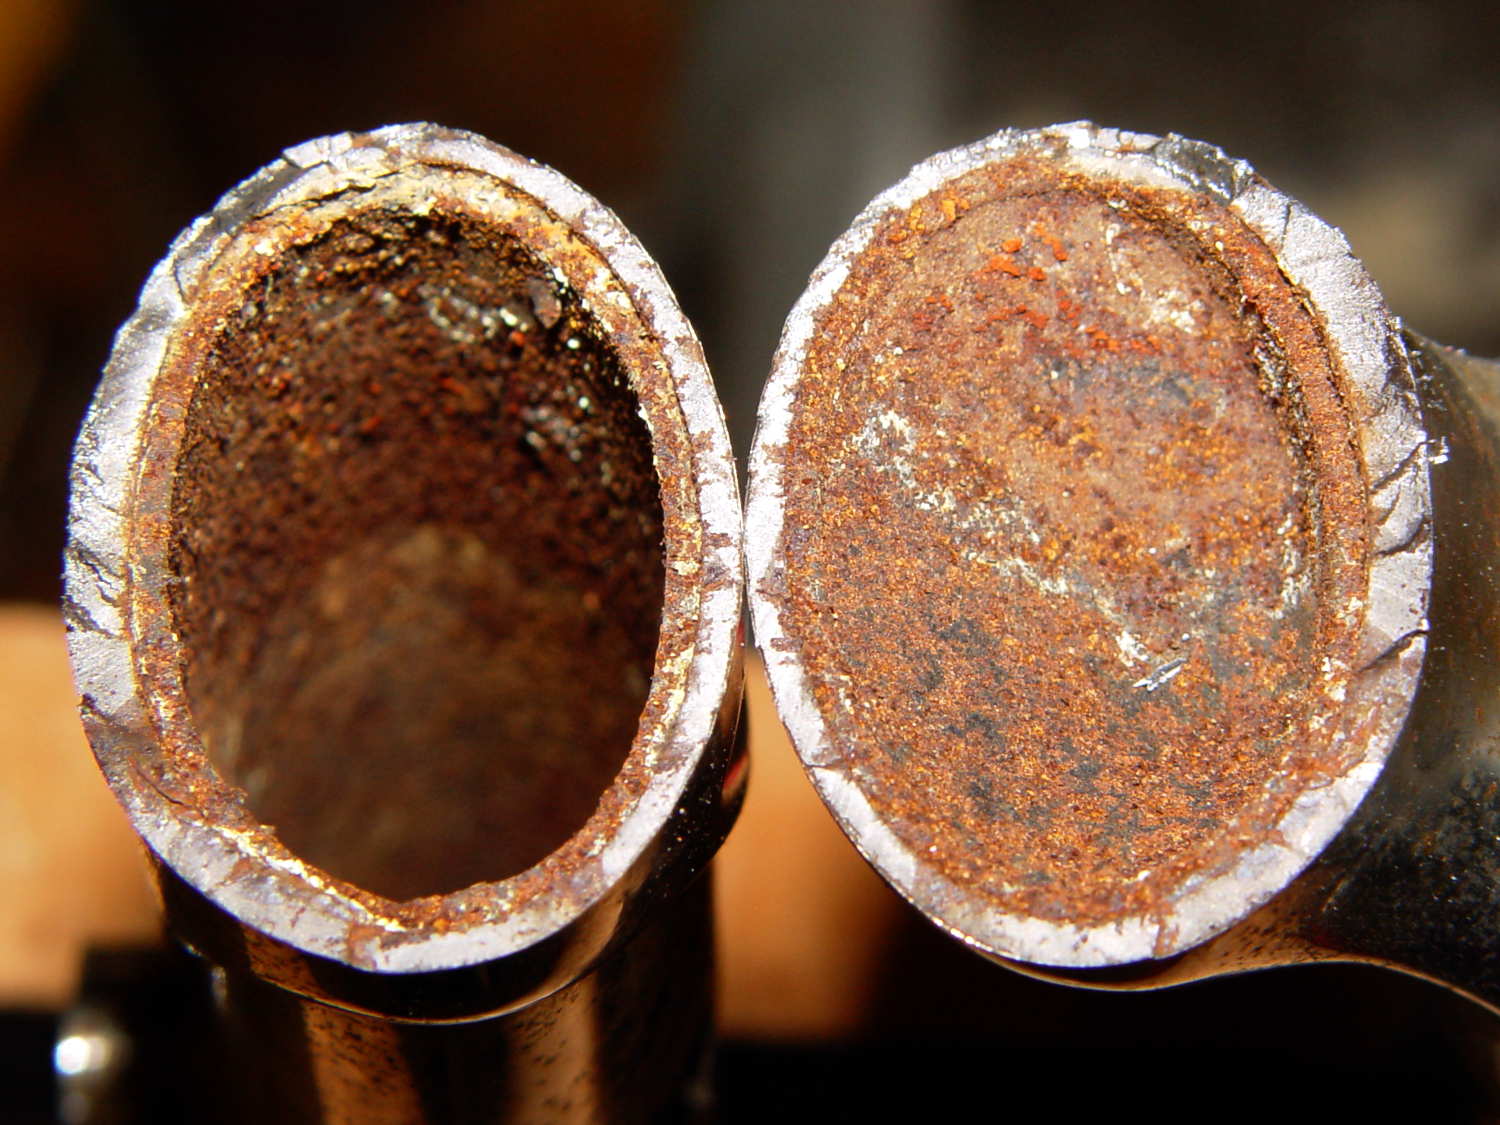
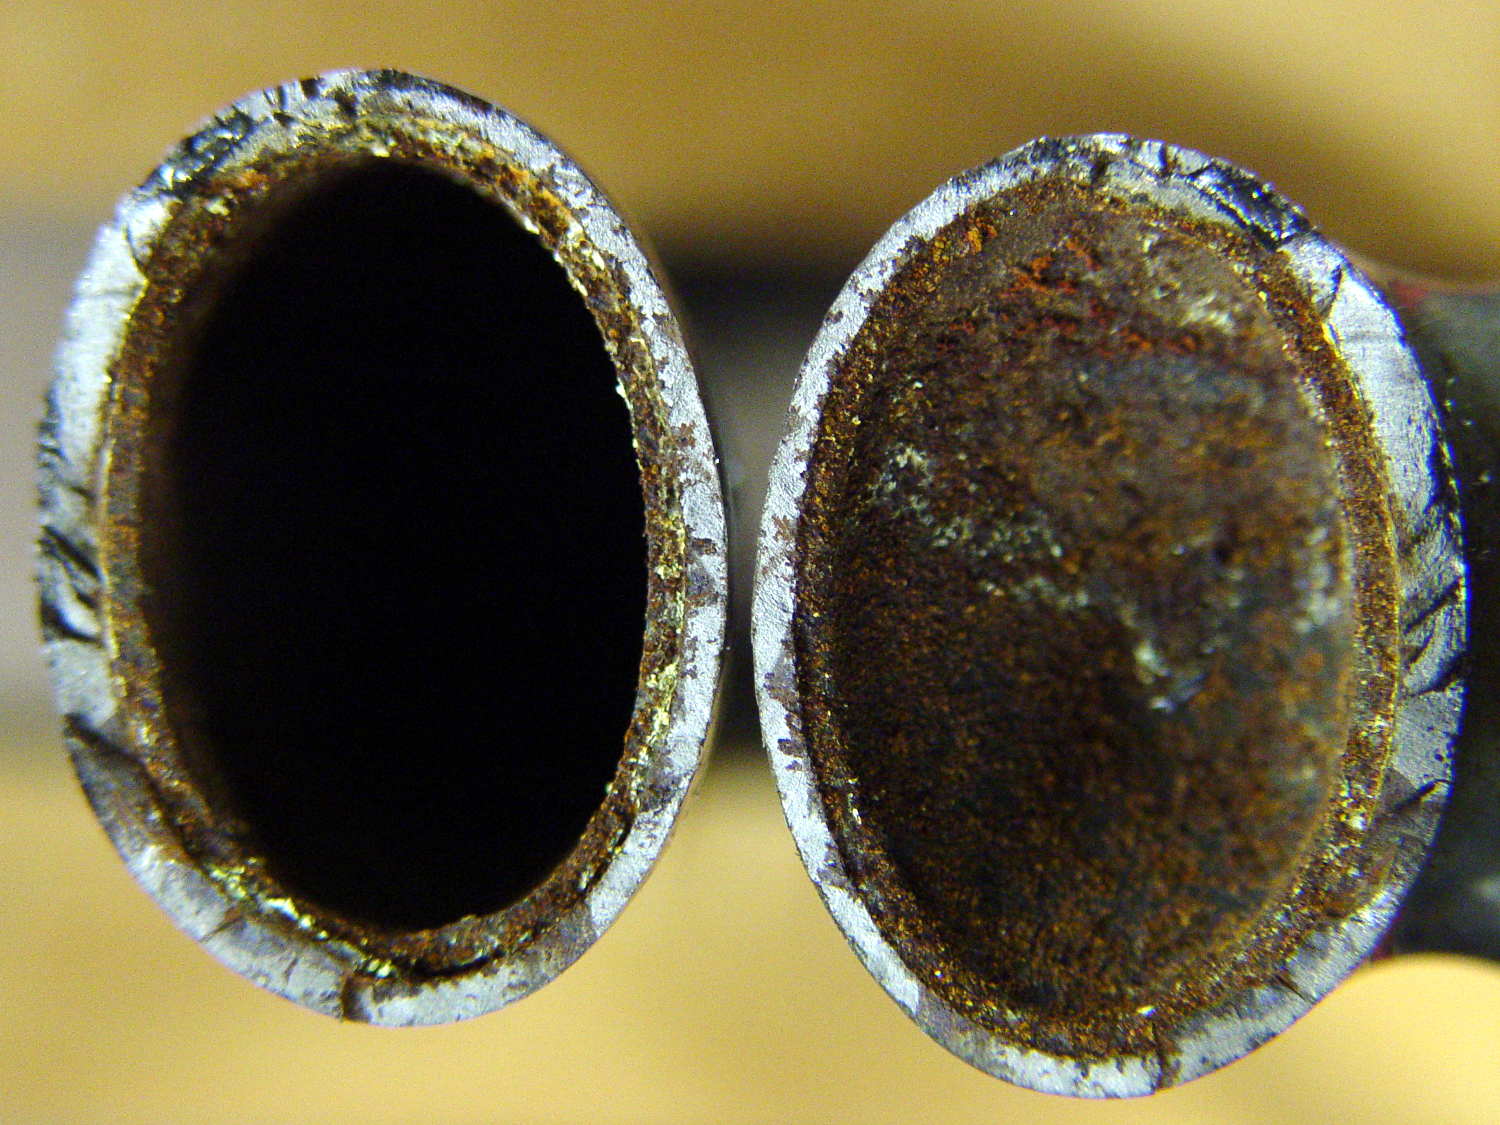
Looks rather grotendous in there, doesn’t it? Yeah, show me the interior of your fork…
The front is at the top, blade on the left and crown on the right. The little shiny rectangle at 1 o’clock on the crown was probably the last fragment holding the blade in place.
I should mention the lamp test in case it comes in useful later on…
	digitalWrite(PIN_HEARTBEAT,LOW);	// turn off while panel blinks

	analogWrite(PIN_DIMMING,LEDS_ON);	// enable LED array

	for (byte i=0; i<NUMROWS; i++) {
		for (byte j=0; j<NUMCOLS; j++) {
			LEDs[i].ColR = LEDs[i].ColG = LEDs[i].ColB = 0x80 >> j;
			for (byte k=0; k<NUMROWS; k++) {
				UpdateLEDs(k);
				delay(25);
				if (GeigerTicked) {
					GeigerTicked = false;
					TogglePin(PIN_HEARTBEAT);
				}
			}
		LEDs[i].ColR = LEDs[i].ColG = LEDs[i].ColB = 0;
		}
	}
	UpdateLEDs(NUMROWS-1);			// clear the last LED
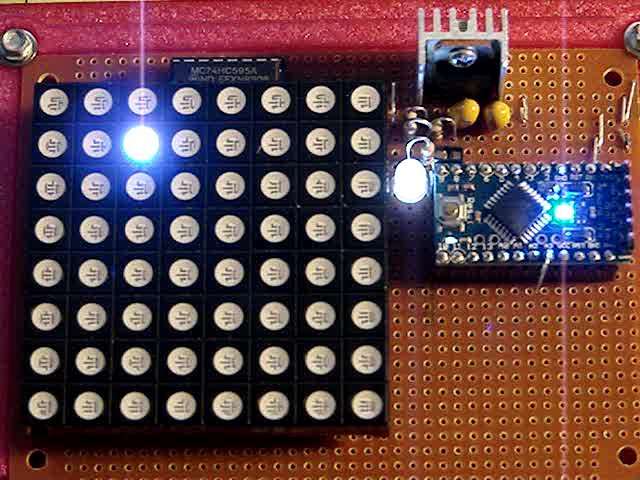
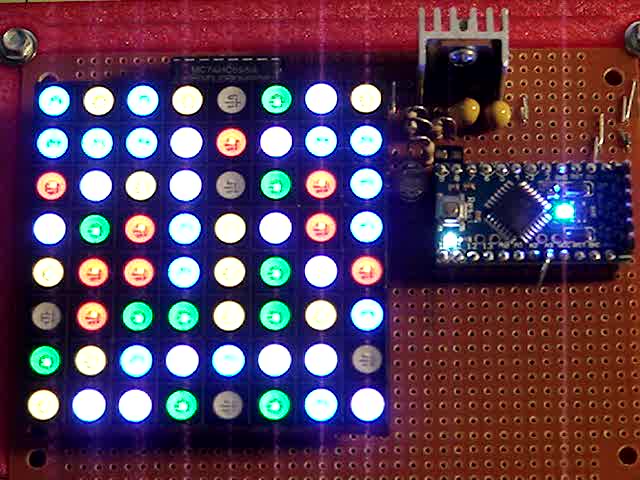
Updating / multiplexing all the rows inside the inner loop with a 25 ms pause produces distinct flashes and demonstrates that each LED operates separately from all the others:
Lamp Test
The lamp test ends with all the LEDs turned off, but having the array gradually fill with light looked odd.
After some tinkering, I added the GeigerTicked conditional to handshake with the Geiger pulse interrupt handler, thus producing a nice random time at the end of the loop. Feed that mostly random time into the hash function, use the hash as the random number seed, then set all the LEDs using random(2) function calls:
	randomSeed(jenkins_one_at_a_time_hash((char *)GeigerTime,4));

	for (byte Row=0; Row<NUMROWS; Row++) {
		for (byte Col=0; Col<NUMCOLS; Col++) {		// Col runs backwards, but we don't care
			LEDs[Row].ColR |= random(2) << Col;
			LEDs[Row].ColG |= random(2) << Col;
			LEDs[Row].ColB |= random(2) << Col;
		}
		UpdateLEDs(Row);
	}

	GeigerTicks = 0;				// reset counter
	GeigerTicked = false;			// resume capture
Which produced a more-or-less random fill that looked better:
Random Preload – bright
Underexposed to reduce the burnout (after a few Geiger events):
Random Preload – dim
There should be about eight of each color and, hey, it’s close enough.
In need of a quick-and-easy way to generate interesting data that would make an LED array do something and, what with radioactivity being the canonical source for random numbers, an ancient Aware Electronics RM-60 (*) emerged from the heap. The manual will get you up to speed on radiation detection, if you can read past the DOS-era program description.
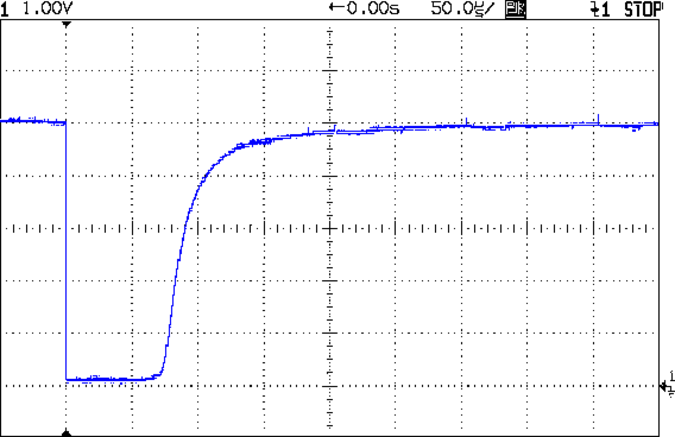
It produces a 100 µs (-ish) pulse for each detection:
Aware RM-60 Geiger Pulse
The minimum period seems to be around 500 µs, but I lack a sufficiently fierce radioactive source to verify that in any finite amount of time.
Seeing as how all we need is a little randomness, measuring the time when a pulse occurs will suffice; we’re not talking hardcore crypto.
With the pulse arriving on the Arduino D2 input, define an interrupt handler that sets a flag, bumps a counter, and records the current time in microseconds:
void GeigerHandler(void) {
	if (!GeigerTicked) {				// stop recording until loop() extracts the data
		GeigerTicked = true;
		GeigerTicks++;
		GeigerTime = micros();
	}
}
Define D2 as an input, turn on the pullup, and trigger that handler on the falling edge of the pulse:
pinMode(PIN_GEIGER,INPUT_PULLUP);	// RM-60 has its own pullup, but add this one, too

attachInterrupt((PIN_GEIGER - 2),GeigerHandler,FALLING);
Because an absolute timestamp of each event will produce an obviously non-random sequence of monotonically increasing numbers, I ran each four byte timestamp through a simple hash function to whiten the noise:
Then the only thing left to do is spin around the loop() while waiting for a particle to arrive:
	if (GeigerTicked) {
		digitalWrite(PIN_HEARTBEAT,HIGH);				// show a blip
		analogWrite(PIN_DIMMING,LEDS_OFF);				// turn off LED array to prevent bright glitch

		Hash = jenkins_one_at_a_time_hash((char *)&GeigerTime,4);	// whiten the noise

		GeigerTicked = false;							// flag interrupt handler to resume recording
//			printf("%9ld %08lx %08lx ",GeigerTicks,GeigerTime,Hash);
		SetLED(Hash);
	}
(*) Circuit Cellar readers of long memory will recognize the RM-60 as the McGuffin for the Radioactive Randoms column in 1990 that explained features of interrupt-driven code in a Micromint BASIC-52 board. Decades later, the hardware & software served as Prior Art in a patent suit that forced me to write some Rules of Engagement. Selah.
At first glance, I thought Mary had taken a tour of The Great Swamp south of the Vassar Farm gardens:
APRS Bicycle Tracking – Flying High
Having helped put the fence up, I’m absolutely certain nothing growing in the garden could get her to 4373 feet, much less boost the bike that high.
Before that, it seems she did some high-speed tunneling:
2015-05-10 18:17:31 EDT: KF4NGN-9>T1TP4X,WIDE1-1,WIDE2-1,qAR,KB2ZE-4:`eP}nAIb/"/k}
   type: location
   format: mice
   srccallsign: KF4NGN-9
   dstcallsign: T1TP4X
   latitude: 41.67466666666667 °
   longitude: -73.88283333333334 °
   course: 345 °
   speed: 42.596 km/h
   altitude: -371 m
   symboltable: /
   symbolcode: b
   mbits: 101
   posresolution: 18.52 m
   posambiguity: 0
The bike’s altitude began falling while she was on the way to the garden, from a reasonable 66 meters on the entrance road, bottoming out at -371 m as she hit 42.6 km/h (!), rising to 1341 meters with the bike leaning against a fence post, and returning to 53 meters as she started riding home.
Obviously, you shouldn’t trust consumer-grade GPS tracks without verification: it can get perfectly bogus numbers from fixes with poor satellite geometry. Altitude values tend to be only close, at best, even when you’re not too fussy about accuracy.
Combining all the records so far into one giant lump:
Well Pit Air Temperature – 2014-10 to 2015-04
Yes, the air temperature really did hover around freezing for two weeks in mid-February. If it didn’t require hoisting a four-inch concrete slab with a rusted lift ring, I’d affix a logger to the copper water pipe running across the pit for some direct samples of the actual water temperature.
It hasn’t ever frozen in the last half-century or so; I’m not going to start worrying now…