|
from chiplotle import * |
|
from math import * |
|
from datetime import * |
|
from time import * |
|
from types import * |
|
import random |
|
|
|
|
|
def superformula_polar(a, b, m, n1, n2, n3, phi): |
|
''' Computes the position of the point on a |
|
superformula curve. |
|
Superformula has first been proposed by Johan Gielis |
|
and is a generalization of superellipse. |
|
see: http://en.wikipedia.org/wiki/Superformula |
|
Tweaked to return polar coordinates |
|
''' |
|
|
|
t1 = cos(m * phi / 4.0) / a |
|
t1 = abs(t1) |
|
t1 = pow(t1, n2) |
|
|
|
t2 = sin(m * phi / 4.0) / b |
|
t2 = abs(t2) |
|
t2 = pow(t2, n3) |
|
|
|
t3 = -1 / float(n1) |
|
r = pow(t1 + t2, t3) |
|
if abs(r) == 0: |
|
return (0, 0) |
|
else: |
|
# return (r * cos(phi), r * sin(phi)) |
|
return (r, phi) |
|
|
|
|
|
def supershape(width, height, m, n1, n2, n3, |
|
point_count=10 * 1000, percentage=1.0, a=1.0, b=1.0, travel=None): |
|
'''Supershape, generated using the superformula first proposed |
|
by Johan Gielis. |
|
|
|
– `points_count` is the total number of points to compute. |
|
– `travel` is the length of the outline drawn in radians. |
|
3.1416 * 2 is a complete cycle. |
|
''' |
|
travel = travel or (10 * 2 * pi) |
|
|
|
# compute points… |
|
phis = [i * travel / point_count |
|
for i in range(1 + int(point_count * percentage))] |
|
points = [superformula_polar(a, b, m, n1, n2, n3, x) for x in phis] |
|
|
|
# scale and transpose… |
|
path = [] |
|
for r, a in points: |
|
x = width * r * cos(a) |
|
y = height * r * sin(a) |
|
path.append(Coordinate(x, y)) |
|
|
|
return Path(path) |
|
|
|
|
|
# RUN DEMO CODE |
|
|
|
if __name__ == '__main__': |
|
|
|
override = False |
|
|
|
plt = instantiate_plotters()[0] |
|
# plt.write('IN;') |
|
|
|
if plt.margins.soft.width < 11000: # A=10365 B=16640 |
|
maxplotx = (plt.margins.soft.width / 2) – 100 |
|
maxploty = (plt.margins.soft.height / 2) – 150 |
|
legendx = maxplotx – 2900 |
|
legendy = -(maxploty – 750) |
|
tscale = 0.45 |
|
numpens = 4 |
|
# prime/10 = number of spikes |
|
m_values = [n / 10.0 for n in [11, 13, 17, 19, 23]] |
|
# ring-ness 0.1 to 2.0, higher is larger |
|
n1_values = [ |
|
n / 100.0 for n in range(55, 75, 2) + range(80, 120, 5) + range(120, 200, 10)] |
|
else: |
|
maxplotx = plt.margins.soft.width / 2 |
|
maxploty = plt.margins.soft.height / 2 |
|
legendx = maxplotx – 3000 |
|
legendy = -(maxploty – 900) |
|
tscale = 0.45 |
|
numpens = 6 |
|
m_values = [n / 10.0 for n in [11, 13, 17, 19, 23, 29, 31, |
|
37, 41, 43, 47, 53, 59]] # prime/10 = number of spikes |
|
# ring-ness 0.1 to 2.0, higher is larger |
|
n1_values = [ |
|
n / 100.0 for n in range(15, 75, 2) + range(80, 120, 5) + range(120, 200, 10)] |
|
|
|
print " Max: ({},{})".format(maxplotx, maxploty) |
|
|
|
# spiky-ness 0.1 to 2.0, higher is spiky-er (mostly) |
|
n2_values = [ |
|
n / 100.0 for n in range(10, 60, 2) + range(65, 100, 5) + range(110, 200, 10)] |
|
|
|
plt.write(chr(27) + '.H200:') # set hardware handshake block size |
|
plt.set_origin_center() |
|
# scale based on B size characters |
|
plt.write(hpgl.SI(tscale * 0.285, tscale * 0.375)) |
|
# slow speed for those abrupt spikes |
|
plt.write(hpgl.VS(10)) |
|
|
|
while True: |
|
|
|
# standard loadout has pen 1 = fine black |
|
plt.write(hpgl.PA([(legendx, legendy)])) |
|
pen = 1 |
|
plt.select_pen(pen) |
|
plt.write(hpgl.PA([(legendx, legendy)])) |
|
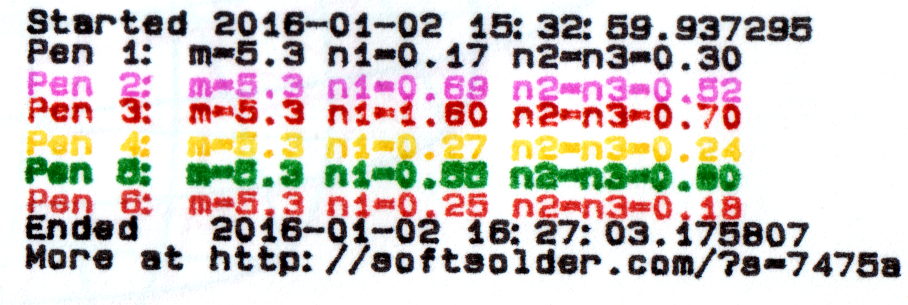
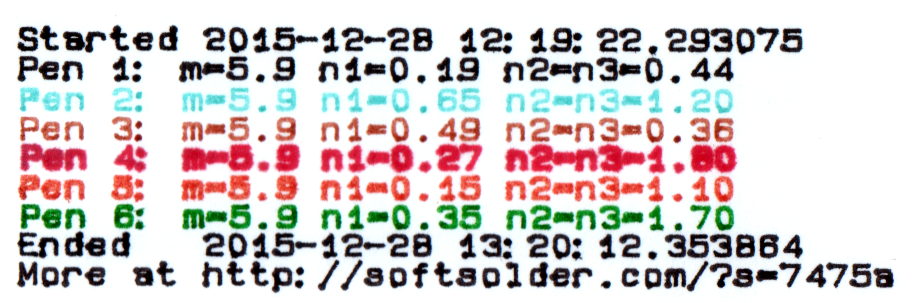
plt.write(hpgl.LB("Started " + str(datetime.today()))) |
|
|
|
if override: |
|
m = 4.1 |
|
n1_list = [1.15, 0.90, 0.25, 0.59, 0.51, 0.23] |
|
n2_list = [0.70, 0.58, 0.32, 0.28, 0.56, 0.26] |
|
else: |
|
m = random.choice(m_values) |
|
n1_list = random.sample(n1_values, numpens) |
|
n2_list = random.sample(n2_values, numpens) |
|
|
|
pen = 1 |
|
for n1, n2 in zip(n1_list, n2_list): |
|
n3 = n2 |
|
print "{0} – m: {1:.1f}, n1: {2:.2f}, n2=n3: {3:.2f}".format(pen, m, n1, n2) |
|
plt.select_pen(pen) |
|
plt.write(hpgl.PA([(legendx, legendy – 100 * pen)])) |
|
plt.write( |
|
hpgl.LB("Pen {0}: m={1:.1f} n1={2:.2f} n2=n3={3:.2f}".format(pen, m, n1, n2))) |
|
e = supershape(maxplotx, maxploty, m, n1, n2, n3) |
|
plt.write(e) |
|
pen = pen + 1 if (pen % numpens) else 1 |
|
|
|
pen = 1 |
|
plt.select_pen(pen) |
|
plt.write(hpgl.PA([(legendx, legendy – 100 * (numpens + 1))])) |
|
plt.write(hpgl.LB("Ended " + str(datetime.today()))) |
|
plt.write(hpgl.PA([(legendx, legendy – 100 * (numpens + 2))])) |
|
plt.write(hpgl.LB("More at https://softsolder.com/?s=7475a")) |
|
plt.select_pen(0) |
|
plt.write(hpgl.PA([(-maxplotx,maxploty)])) |
|
|
|
print "Waiting for plotter… ignore timeout errors!" |
|
sleep(40) |
|
while NoneType is type(plt.status): |
|
sleep(5) |
|
|
|
print "Load more paper, then …" |
|
print " … Press ENTER on the plotter to continue" |
|
plt.clear_digitizer() |
|
plt.digitize_point() |
|
|
|
plotstatus = plt.status |
|
while (NoneType is type(plotstatus)) or (0 == int(plotstatus) & 0x04): |
|
plotstatus = plt.status |
|
|
|
print "Digitized: " + str(plt.digitized_point) |
|
|