After another two months:
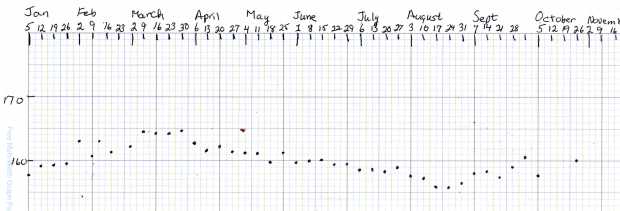
The trend is definitely not uniformly downward, perhaps due to my increasing ability to accelerate (small) masses against the local gravity vector and, definitely, garden harvest season. My pants still fit fine, if that’s any indication.
I’ll add a skin-fold caliper dot to the weekly record after I can get repeatable measurements, perhaps by marking the test spot with a Sharpie.

Comments
8 responses to “Monthly Science: Weight”
I got a little more carried away. I record the data in a text file and run it through a Kalman filter (via SciLab) and then gnuplot. The Kalman filter smooths out the noise and provides a rate estimate.
I grovel, I abase myself, I kiss your feet: geekery of the first water!
“Von Neumann liked to eat and drink; his wife, Klara, said that he could count everything except calories.”
https://en.wikipedia.org/wiki/John_von_Neumann#Early_career_and_private_life
Also true: “If you don’t eat, you die.”
Words to live by …
You could tattoo measurement locations. Sharpie would wear off. :-D
I am such a sissy …
Perhaps any sufficiently repeated Sharpie becomes indistinguishable from a tattoo?
If you get consistent results from skinfold, you’ll have solved a significant problem. Inter-rater reliability is right on par with eyeballometric methods – aka, “garbage”. You might consider extracting information from your APRS tracks – “what you can do” is, clinically, the only metric that matters.
Sounds about right to me!
One significant data point: I can now mow the lawn in one session, with a break in the middle, in a bit under three hours. I used to do the front half, then the back half, on successive days. I still feel a nap comin’ on strong when I’m done, but now it doesn’t blot up two afternoons.