Ed Nisley's Blog: Shop notes, electronics, firmware, machinery, 3D printing, laser cuttery, and curiosities. Contents: 100% human thinking, 0% AI slop.
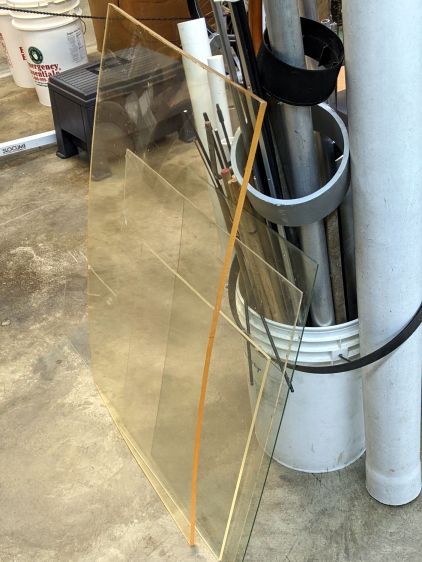
That big yellowed sheet is 9 mm = 3/8 inch thick, with an inch of warp, entirely enough to keep it out of the laser cutter.
So I cleared some floor space and loaded the sheet with a collection of scrap steel sufficient to bend it the other way:
Acrylic sheet unwarping
The main weight comes from a perfectly sized snippet of railroad rail, topped off with steel disks, angle iron, and a rugged scissors jack
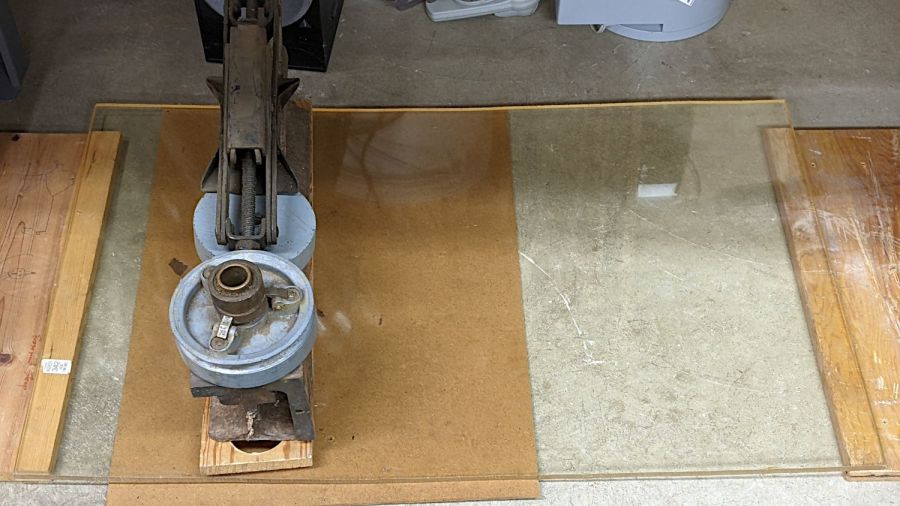
The sheet didn’t touch the floor, so the weight kept stress on the plastic and it gradually flowed the other way:
Mostly unwarped acrylic sheet
The center remains 5 mm higher than the edges and, given that cold-flowing is at best an exponential process, I recently declared victory and added it to the stockpile. I’ll gnaw off small pieces for any given project, so the remaining warp won’t matter.
The rule of thumb says a CO₂ laser cutters needs 10 W per millimeter of acrylic, so my 60 W laser will be somewhat underpowered. Two or three passes should suffice and, for sure, nobody will kvetch about edge quality.
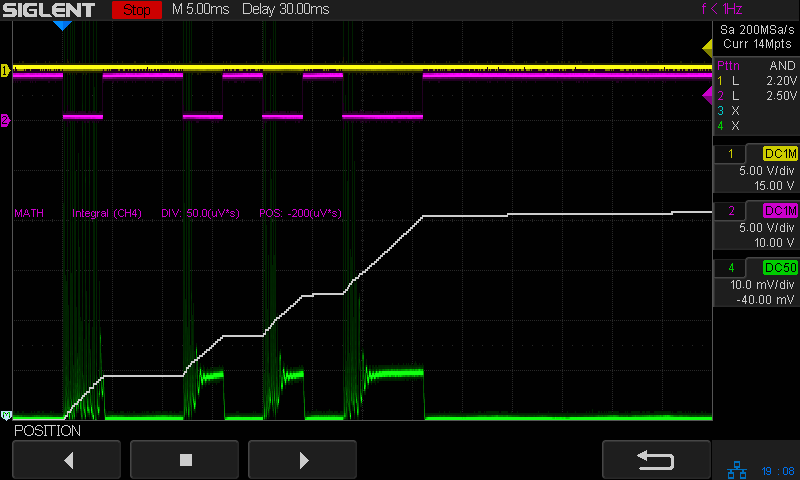
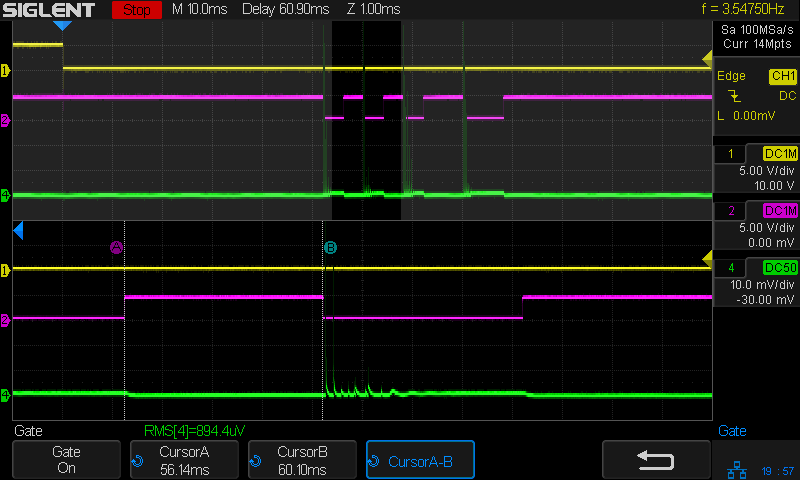
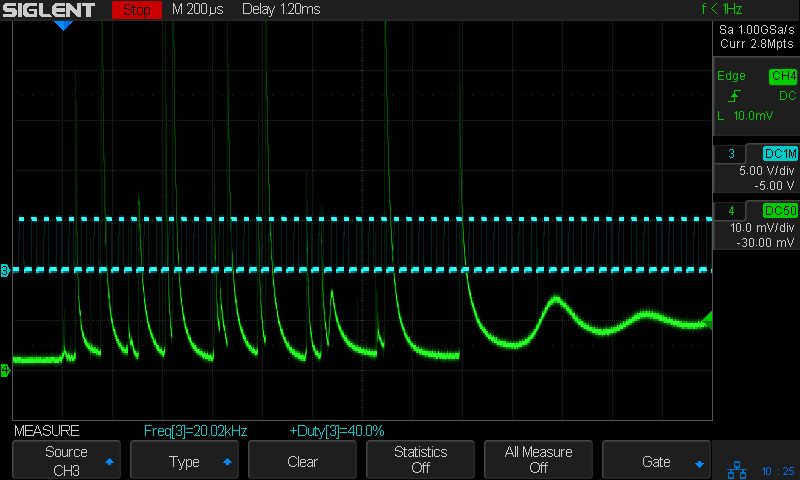
With the laser cutter set up as before and the scope set up to calculate the time integral of the tube current, this happens:
Tube Current – 40pct pattern – integ – 10 ma-div
The trigger is the Boolean AND of the top two traces:
DIR signal = low = left-to-right X axis motion
L-ON signal = low = laser power supply output enabled
The bottom trace is the laser tube current at 10 mA/div, which is, conveniently, also the scope vertical axis calibration, so you can read “amp” wherever you see “volt”. The four pulses correspond to a single scan line through the usual test pattern:
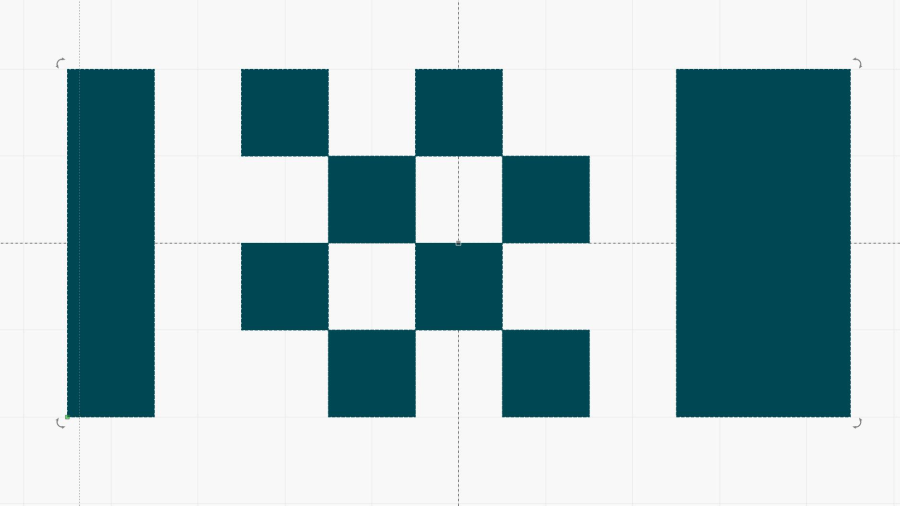
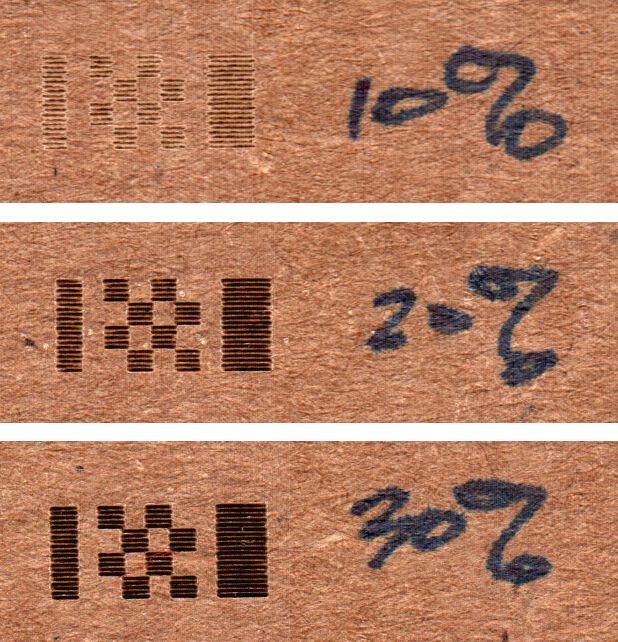
Pulse Timing Pattern – 1 mm blocks
Scanning at 250 mm/s, each 1 mm block occupies 4 ms and the 2 mm block on the right is 8 ms long.
With all that in mind …
The white line in the scope screenshot is the time integral of the current, scaled at 50 µV·s/div and read as 50 µA·s/div due to the 10 mV/div = 10 mA/div equivalence. The integral is pretty much a straight line up and to the right during each pulse, showing that the power supply delivers a nearly constant average current despite the random-looking spikes in the shorter pulses, the oscillations at the start of the longer pulse, and the reasonably flat section after the current settles down.
Say it again: Totally did not expect that.
A closer look at the first pulse of a different line:
Today I Learned: The per-division scale of the white integral line is completely bogus in Zoom mode. Although the display still shows 50 µA·s/div (magenta text obscured near the middle), the integral line rises seven divisions. Some fiddling around showed there is norelation between the calibrations of the normal display and those in Zoom mode.
What is important: seeing the integral as pretty much a straight line with a reasonably constant slope, if you’re willing to ease over the bumps due to the current spikes. The slope of that line (yeah, the derivative of the integral, for a chunky definition of derivative) gives the average tube current.
Referring to the non-Zoomed trace, the integral rises by about 40 µA·s during each 4 ms pulse (and twice that for the 8 ms pulse), for an average current of 40 µA·s / 4 ms = 10 ma. Having previously established 100% PWM corresponds to 24 mA, 40% of 24 mA = 9.6 mA seems about as close as one might expect.
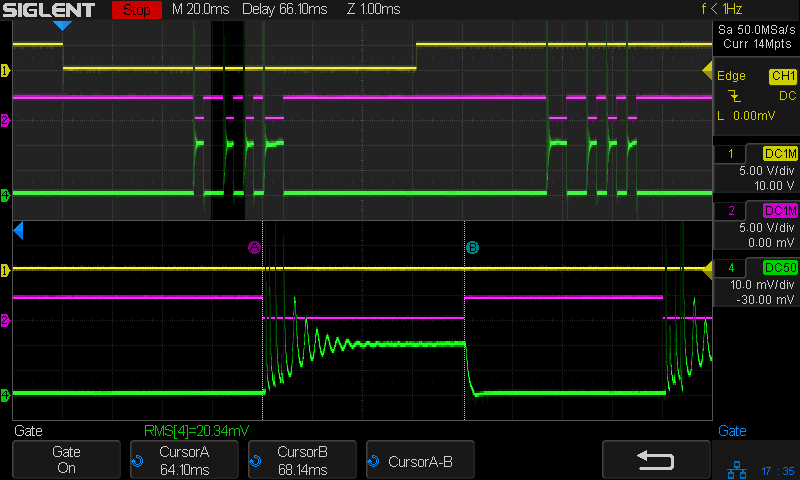
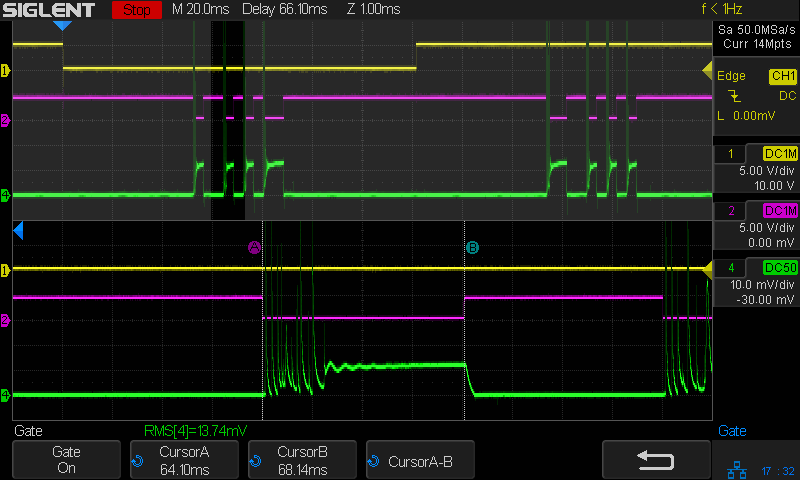
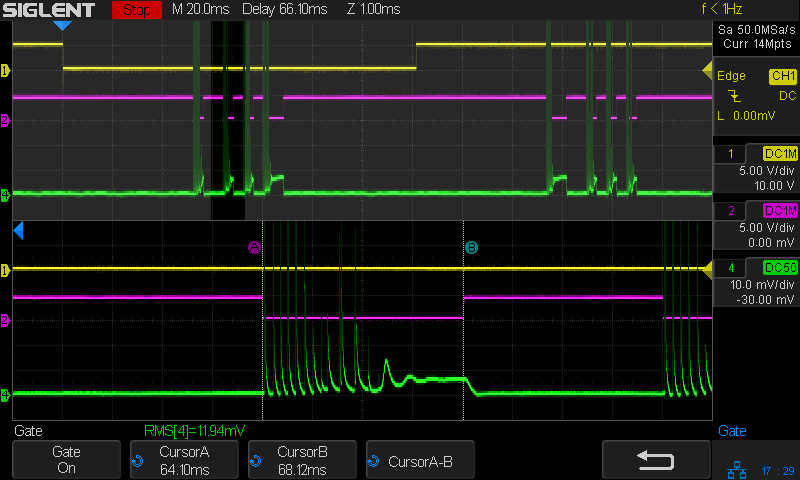
Each square is 1 mm on a side and the pattern runs at 250 mm/s, so the laser will be enabled for 4 ms. For example, the test setup shows the result of a pass at 50% PWM:
The two cursors mark the duration of one block, with the laser current in the bottom trace starting off with the usual off-screen spikes, then settling down to a constant-ish 13-ish mA for the rest of the block. The 13.74 mARMS value (the AM502’s 10 mA/div matches the scope’s 10 mV/div, so you can read mV as mA) includes some part of those spikes (the higher gain clips the tips), but most of it comes from the stable-ish portion.
The whole measurement set as a slide show for your amusement:
I expected the line to pass through the origin, which it most certainly does not. One could make up a story about how the 30% and 40% PWM points are Close Enough to the line to sorta pull the bottom end over to the left a little, but even that doesn’t explain the known-to-be-weird results below 30% PWM.
A better story might be that 30-ish% PWM produces the minimum current required to fire the laser tube. Operating below that current works, in the sense that the laser produces a beam, but it’s out of spec. Running above that current eventually lets the power supply reach an agreement with the tube as to the operating point.
As before, those measurements do not account for the reasonably consistent results of scorching some cardboard:
Laser power settings of 10, 20, and 30% obviously produce different results:
Pulse Timing Pattern – cardboard – 10 20 30 pct
However, the scope traces for PWM values under about 25% all look pretty much like this:
Tube Current – 10pct – 250mm-s – 5ma-div
Rather than a simple constant current source, the power supply produces very high amplitude current pulses for low PWM inputs, with no visible differences between any of the PWM values.
The scope can compute the RMS value of (a section of) the trace, so I aimed it at traces captured from the upper left block of this test pattern:
Pulse Timing Pattern – 1 mm blocks
Because the pulses have such a high amplitude, I set the Tek AM502 current amp at 100 mA/div to capture the entire pulse. Measuring a part of the trace without a signal gives the baseline noise level:
The scope display is 10 mV/div, so 1 mVRMS (close enough to the 894.4 µV reported just above the bottom label row) means 10 mARMS of noise. Given that 100% PWM corresponds to about 25 mA (DC-ish during the pulse), the RMS numbers may not have any significant figures.
A slide show of the results so you can page through them:
There is a 1 mm white bar to the left of the leftmost black bar as a scope trace marker and 2 mm white bar to the right of the rightmost black bar for direction confirmation.
Setting the image to 254 dpi = 10 pix/mm makes the bars exactly 10 pixels wide and scanning at 100 mm/s makes them 10 ms wide. They’re tall enough to simplify scope triggering and capture.
Although using a black bar for 0% PWM = 0 mA and a white bar for 100% PWM makes numerical sense, at least to me, it’s the other way around for laser cutting / engraving: black = 100% and white = 0%. With the layer set to Fill in LightBurn, turn the layer’s Negative Image switch on, and everything comes out right.
Engraving a good grayscale or 3D image is a can of worms, so I just fired the beam into a shallow pan of water.
With signals and traces arranged as before, the beam current shows the same huge spikes during the 10% and 20% PWM bars and at the start of the 100% PWM bars:
Tube Current – grayscale bars – 100mm-s 100ma-div
At 100 mA/div, those spikes look to be 400 mA tall.
A closer look with the current scaled to 10 mA/div:
Tube Current – grayscale bars – 100mm-s 10ma-div
The controller sets L-ON high whenever the beam current should be zero, so the power supply is disabled during the 0% PWM bars. Note the descending glitch at the start of the 10% PWM bar: perhaps the power supply stayed all charged up from the 100% white bar on the left edge and took a few milliseconds to begin tracking the lower current setting.
Each step of what should be a stairway from 10% to 100% PWM has about 2 ms of good old single-pole response. The steps from 70% upward have enough ripple to obscure the steps; the rightmost 100% PWM bar show the ripple doesn’t damp down for 20 ms.
Eyeballometrically, the ramp compresses on the high-current end: equal PWM steps produce less current per step. The current spikes make PWM values of 10% to 20% look awful, PWM between 30% and 50% seem more linear, and increments beyond 60% are rather compressed. The slight nonlinearity makes no practical difference, particularly because the usual recommendation is to not exceed 70%-ish PWM to prolong the tube life.
A continuous grayscale gradient:
Gray gradient
As before, there’s a 1 mm white bar on the left and a 2 mm white bar on the right, with the image inverted to make the white bars 100% PWM.
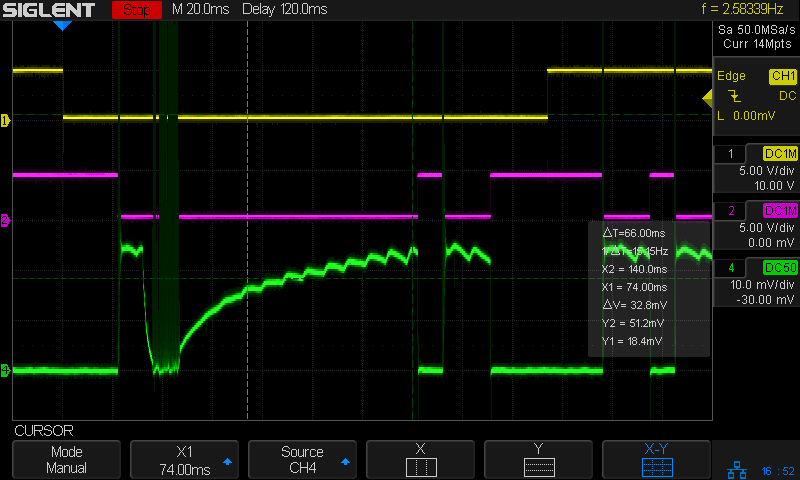
Apparently the power supply can’t regulate the current down from the 100% PWM bar fast enough to match the 0% PWM start of the ramp:
Tube Current – gray ramp – 100mm-s 10ma-div
The compressed relation between PWM and current shows there’s definitely not much benefit in driving the tube beyond about 60% PWM.
There are no high-current spikes in that screenshot, despite having a 0% to 100% PWM gradient.
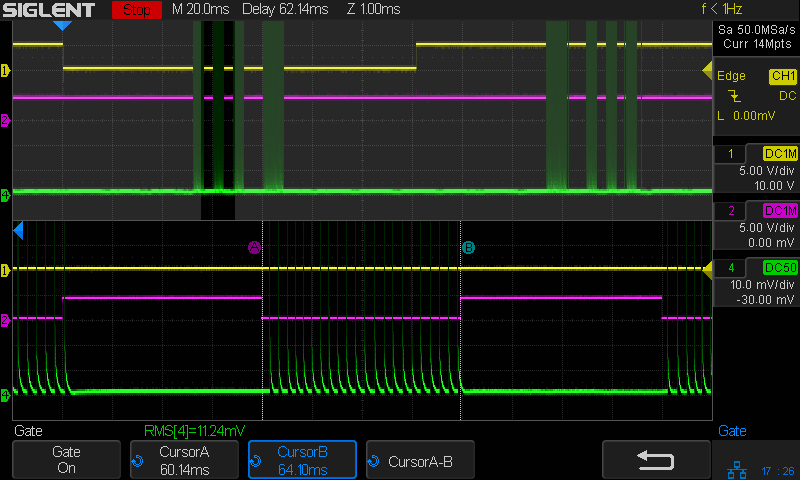
Unlike the gray bars in the first test image up top, this is a continuous ramp and shouldn’t have any discontinuities. The vertical cursors span eight ripples and sit 66 ms apart, which works out to 8.25 ms/ripple. Flip it upside down and you’re looking at 120 Hz ripple from the full-wave bridge rectifier feeding the high-voltage converter. You’d expect solid low-pass filtering after the high-frequency flyback transformer, so the input filter must have the smallest possible caps the designers could possibly use.
Another smooth gradient preceded by a 10% PWM bar and bracketed by the same white bars:
Gray gradient – 10 pct bar
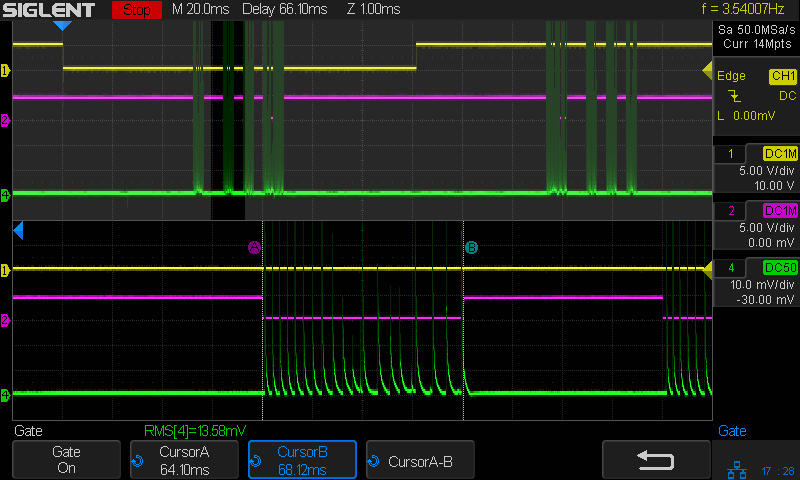
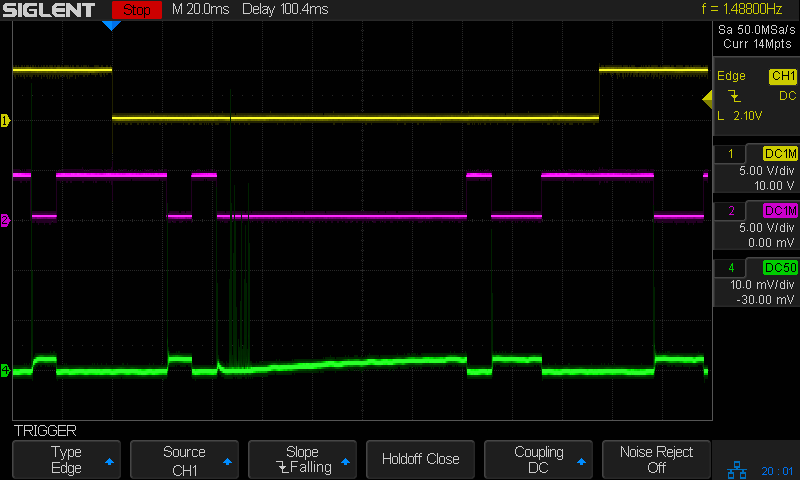
The current waveform is … odd:
Tube Current – gray ramp – 10 PWM bar – 100mm-s 10ma-div
The high-current spikes following the 100% PWM bar on the left occupy the 10% PWM bar and the start of the gradient, up to about 20% PWM. Apparently the spikes happen while the power supply attempts to produce more-or-less continuous current at PWM values below about 25%
I set the layer speed at 250 mm/s = 4 ms / mm, then set PWM (a.k.a. “power”) for each test, and measured the results, which look like this for three power levels on corrugated cardboard:
Pulse Timing Pattern – cardboard – 10 20 30 pct
The scan interval of 0.2 mm produces distinct lines at 10% PWM, the lower limit of the laser’s range. The lines remain separate at 30%, although their width is definitely increasing.
Yesterday’s post explains the test wiring setup and the signals in the scope screenshots.
The 10% PWM current waveform looks like nothing you’d expect:
Tube Current – 10pct – 250mm-s – 5ma-div
The scope triggers at the start of a left-to-right scan line, with 50 ms devoted to ramping up the speed to 250 mm/s before the start of the vertical bar along the left edge and slowing down before reversing.
The green trace shows huge spikes in the laser current, not a well-defined DC current pulse, and they’re offscale beyond 30 mA at 5 mA/div. The baseline sits well above the 0 V line due to the AM502 amplifier’s breathtaking thermal drift; I occasionally touch it up, but the current really is zero between the pulses.
Similarly for 20% PWM:
Tube Current – 20pct – 250mm-s – 5ma-div
Even through there’s little visible difference between the 10% and 20% current waveforms, there’s a distinct difference in the actual beam power delivered to the cardboard.
At 30% PWM the beam current looks a bit more reasonable:
Tube Current – 30pct – 250mm-s – 5ma-div
The 2 mm = 8 ms bar on the right gives the current time to stabilize at 6 mA, but all of the pulses have at least 3 ms of spikes. The first pulse definitely looks worse, so it seems the power supply gets better as the scan line progresses.
At 40% PWM the beam current pulses look more like pulses:
Tube Current – 40pct – 250mm-s – 5ma-div
They still have 3 ms or so of those startup spikes, as seen in this closer look at the first pulse in a line, scaled at 10 mA/div (along with the PWM drive signal):
Tube Current – 40pct PWM first detail – 250mm-s – 10ma-div
The top of those spikes exceed 70 mA!
At 80% PWM, the current waveform looks like a damped tank circuit:
Tube Current – 80pct first – 250mm-s – 5ma-div
The 20 mA at the end of that pulse suggests the maximum tube current would be 25 mA, which is undoubtedly why OMTech recommends running at no more than 70% PWM = 17-ish mA.
The pulses start immediately after the L-ON signal goes active and stop promptly when it goes inactive, so there’s no question about the responsiveness. What baffles me is why the current looks the way it does.
I must figure out how to have the scope compute the RMS value of those spikes, with a sufficiently large mA/div setting to keep the entire range of the pulses on the screen.
Having seen some rather bizarre laser tube current waveforms from the replacement power supply (and an equivalent Cloudray supply I bought as a backup) in the OMTech 60 W laser, I finally got A Round Tuit for a closer look.
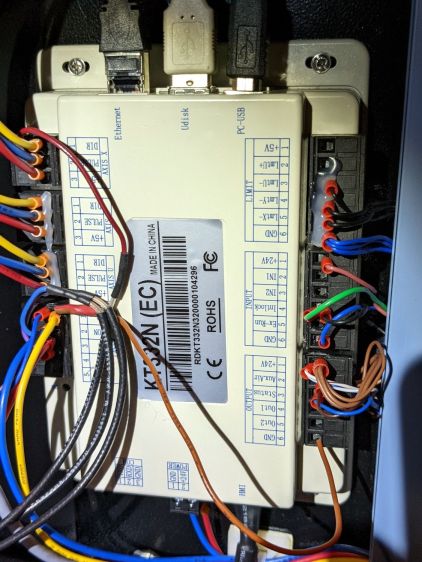
I tapped three signals from the Ruida KT332N controller by the simple expedient of crunching wires into the output terminal clamps along with their original ferrules:
KT332N controller – Tube Current test connections
From top to bottom:
X axis DIR: low = left-to-right motion = toward X+
Laser L-ON: low-active laser beam enable
PWM: pulse-width modulation laser power control
Those three cables pass through a small hole in the cabinet to the left of the hatch on their way to channels 1, 2, and 3 of the scope.
The PWM signal (cyan, channel 3) isn’t particularly useful, but a quick look confirmed it is an active-high signal ticking along at 20 kHz, with a duty cycle corresponding to the selected laser “power”:
Tube Current – 40pct PWM first detail – 250mm-s – 10ma-div
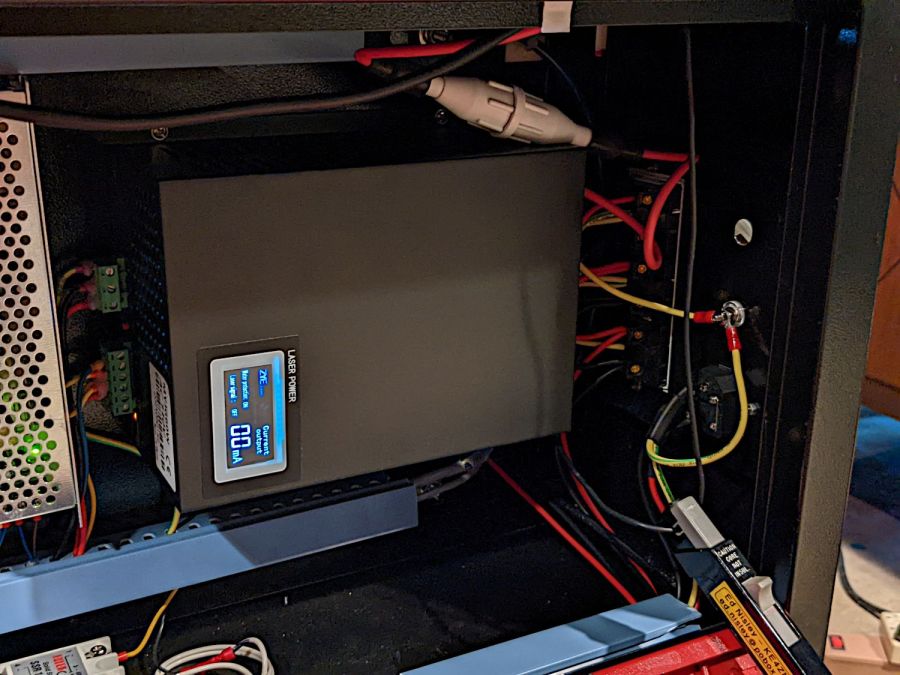
The bottom trace (green, channel 4) is the laser tube current, as monitored by a Tek A6302 Hall-effect current probe around the tube’s cathode (low voltage return) lead:
HV laser power supply – current probe setup
This time around, I poked a bight of that overly long wire through the hole in the cabinet (just above the power-line earth ground terminal) so I could keep the probe outside the cabinet and close the hatch.
Minus the PWM signal, the scope looks like this:
Tube Current – 40pct – 250mm-s – 5ma-div
The top trace (yellow, channel 1) is the DIR signal, with a high-to-low transition triggering the scope when the X axis begins moving from left to right.
The second trace (magenta, channel 2) is the L-ON laser enable; the high-voltage power supply drives current through the laser tube only when L-ON is low.
The third trace (green, channel 4) is, as above, the laser tube current. The Tek AM502 amplifier sets the gain, with the scope channel always set to 10 mV/div with a 50 Ω input impedance, so I must put the current scale in the screenshot file name (which becomes the caption here).
With all that in mind, the next few posts will make more sense … and I can remember what I did.