Homeostasis is a thing:

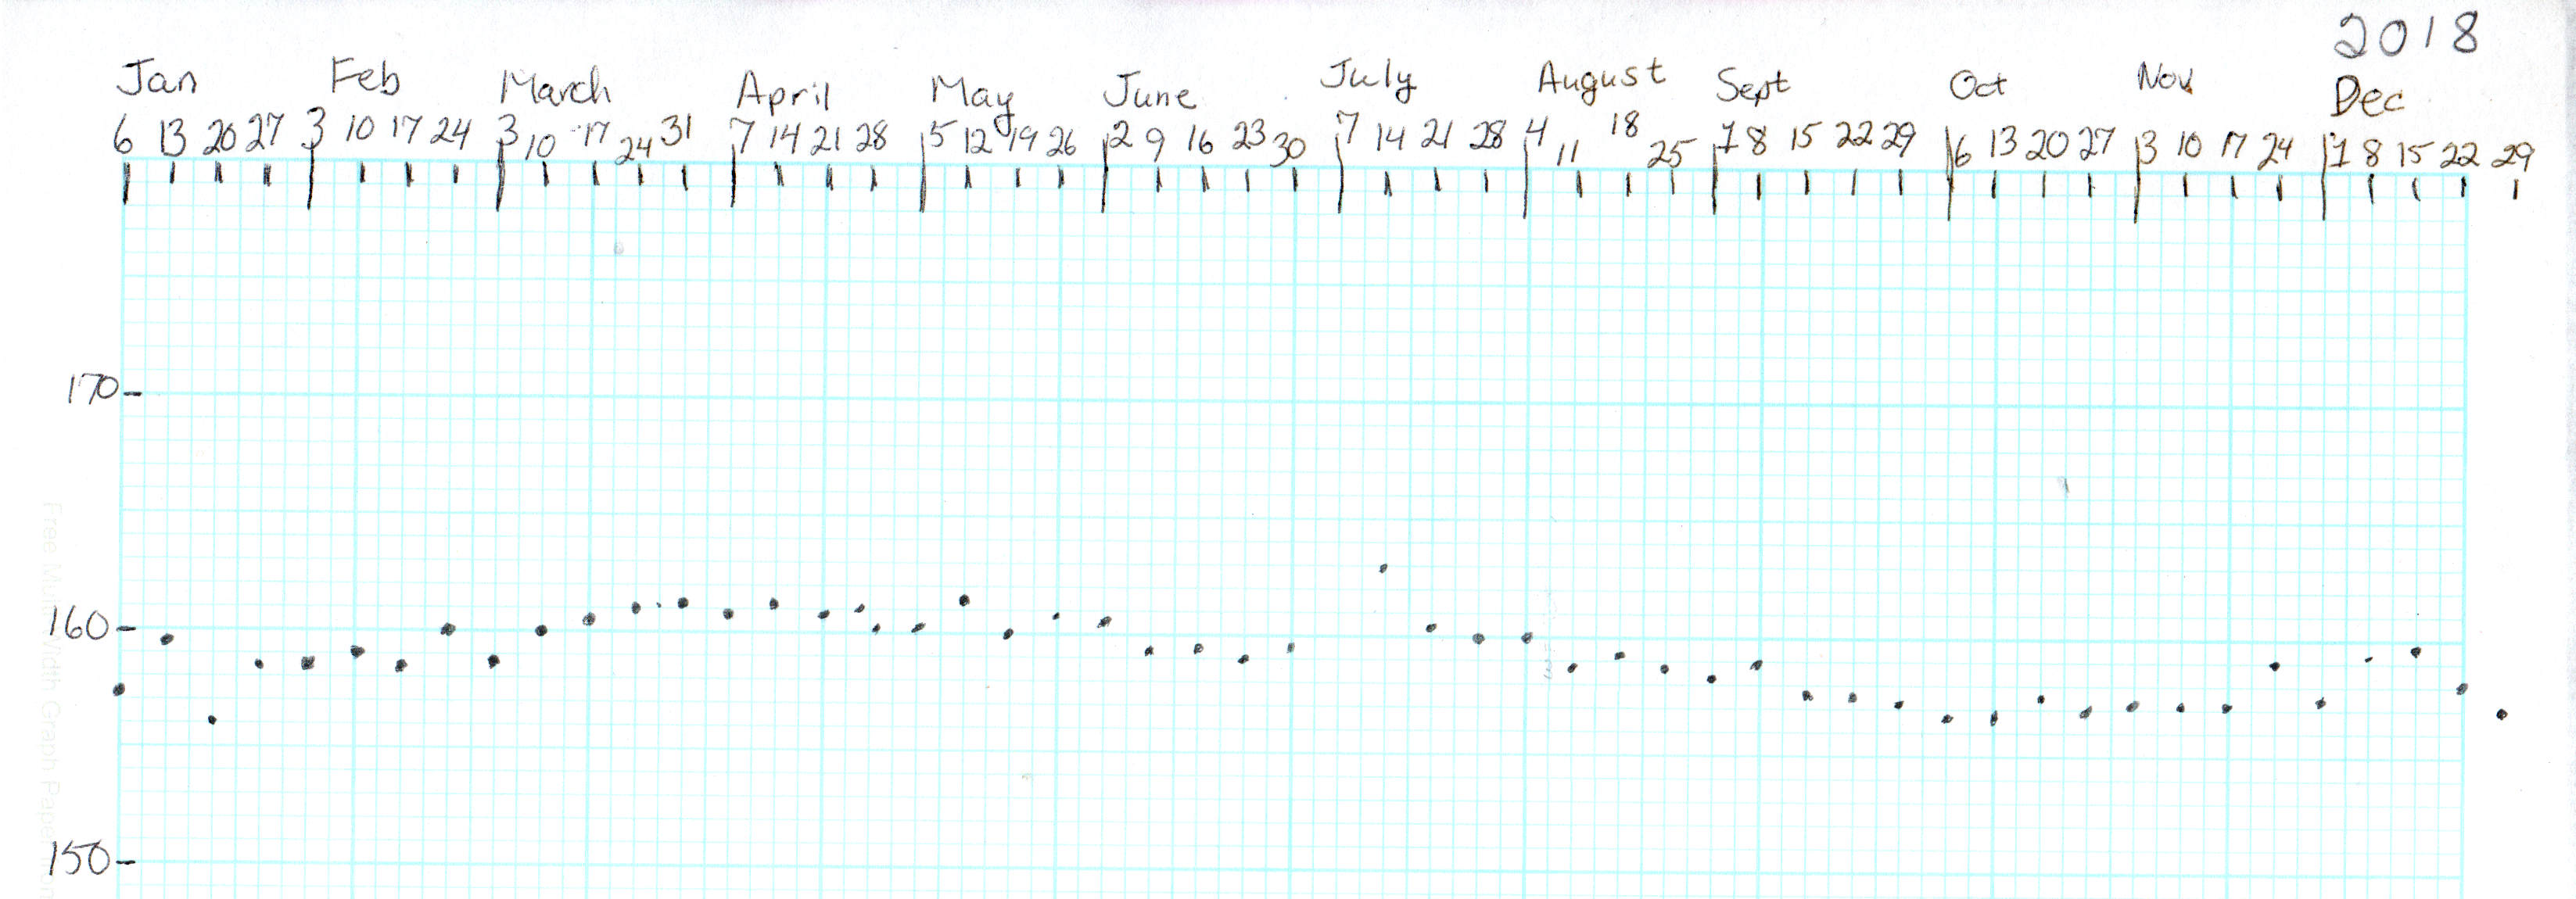
On the other paw, the eyeballometric trend line since mid-April slopes at -1 lb/month and arrives at just over 150 lb in December, so progress continues apace.
The Smell of Molten Projects in the Morning
Ed Nisley's Blog: Shop notes, electronics, firmware, machinery, 3D printing, laser cuttery, and curiosities. Contents: 100% human thinking, 0% AI slop.
If you measure something often enough, it becomes science
Homeostasis is a thing:
On the other paw, the eyeballometric trend line since mid-April slopes at -1 lb/month and arrives at just over 150 lb in December, so progress continues apace.
Mary saw a fox trotting behind the garden, gripping a (dead) turkey chick in its jaws, with the hen in hot pursuit. The fox dropped the chick, circled the pine grove, picked up the chick, and departed stage right. The hen eventually led her remaining chicks into the yard, but gathered them underneath while watching for danger:

She settled down for a few minutes:
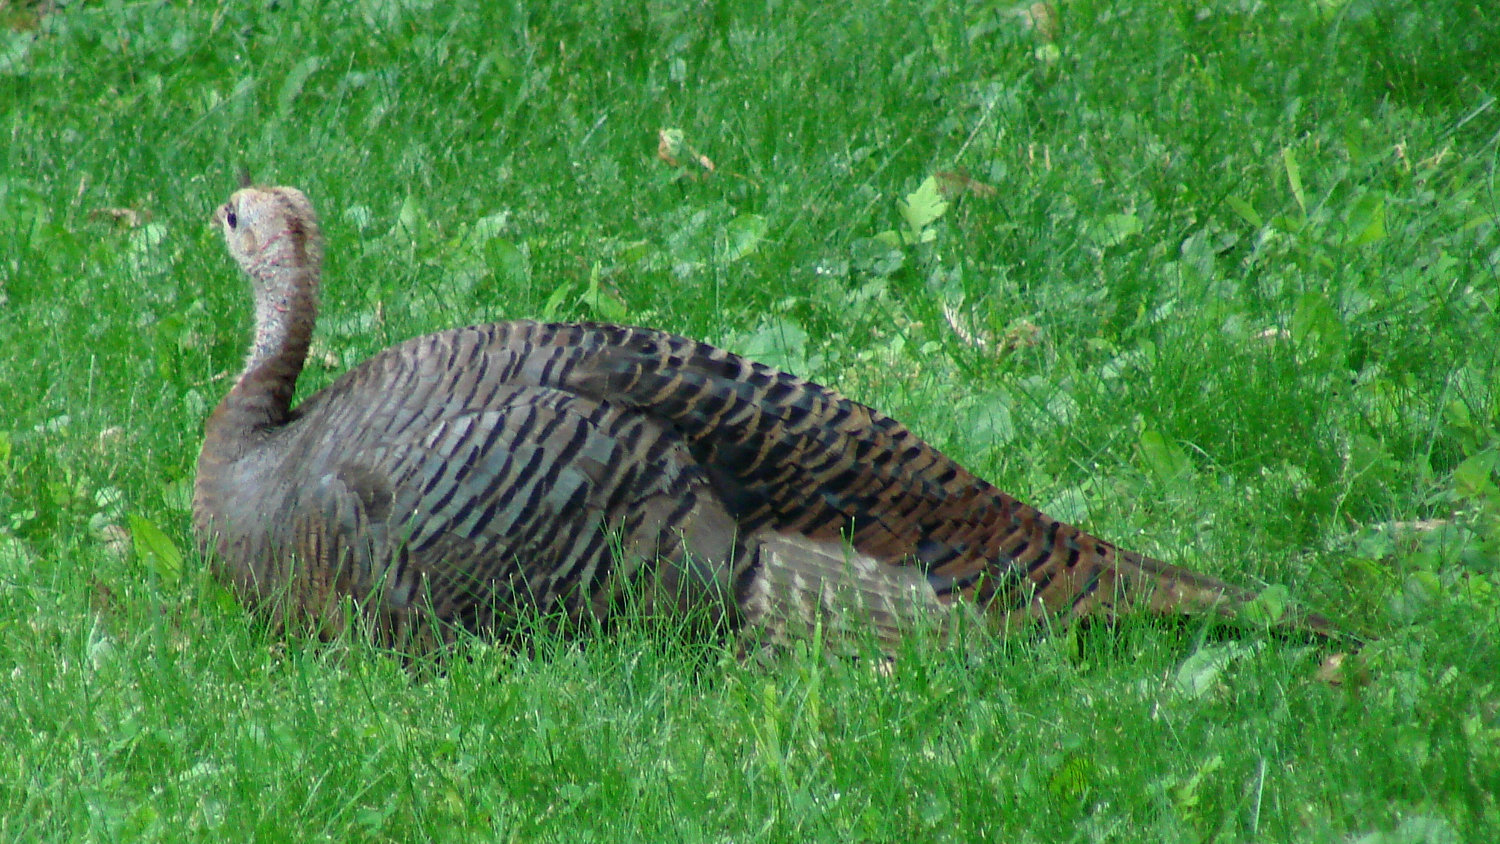
With the fox safely departed, she released the chicks:

Then they returned to foraging, with one chick trying out its wings:

Two days earlier, she led nine chicks through the yard; we think the fox picked off a chick a day. She lost two more during the next four days, suggesting they rapidly improve their ability to scamper out of harm’s way.
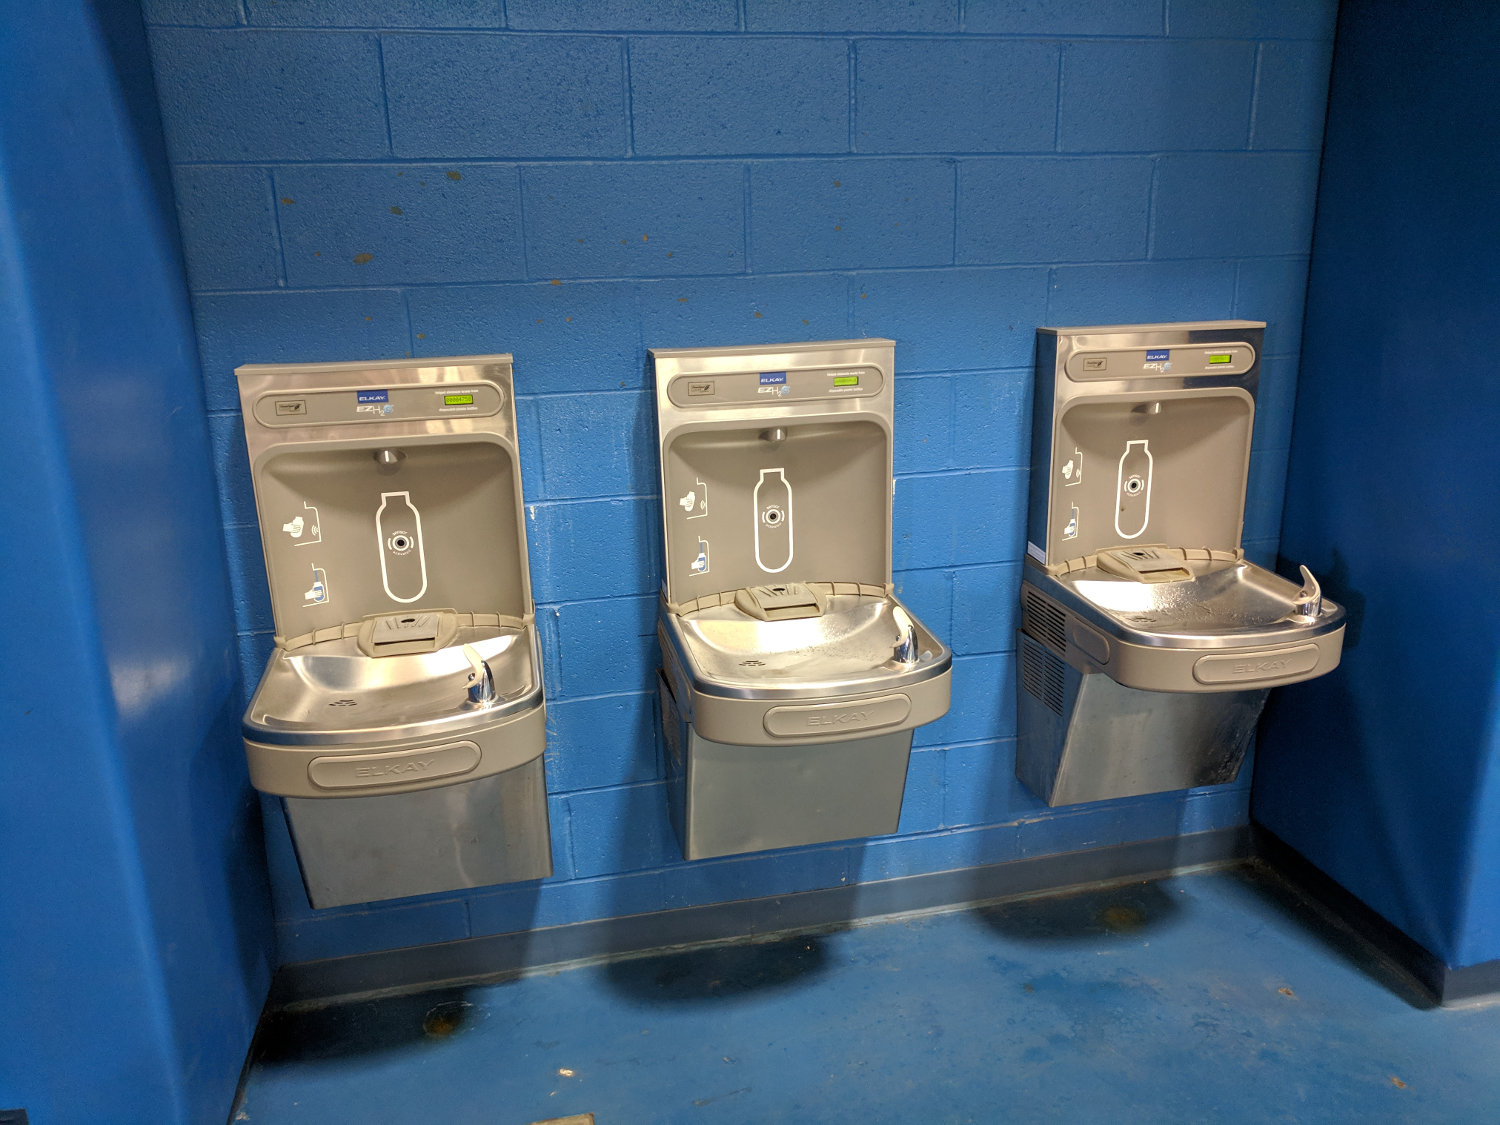
This year’s Northern Star Quilt Guild show in the O’Neill Center at WCSU gave me an opportunity to update last year’s data points, although not quite in the way I expected.
The overview:
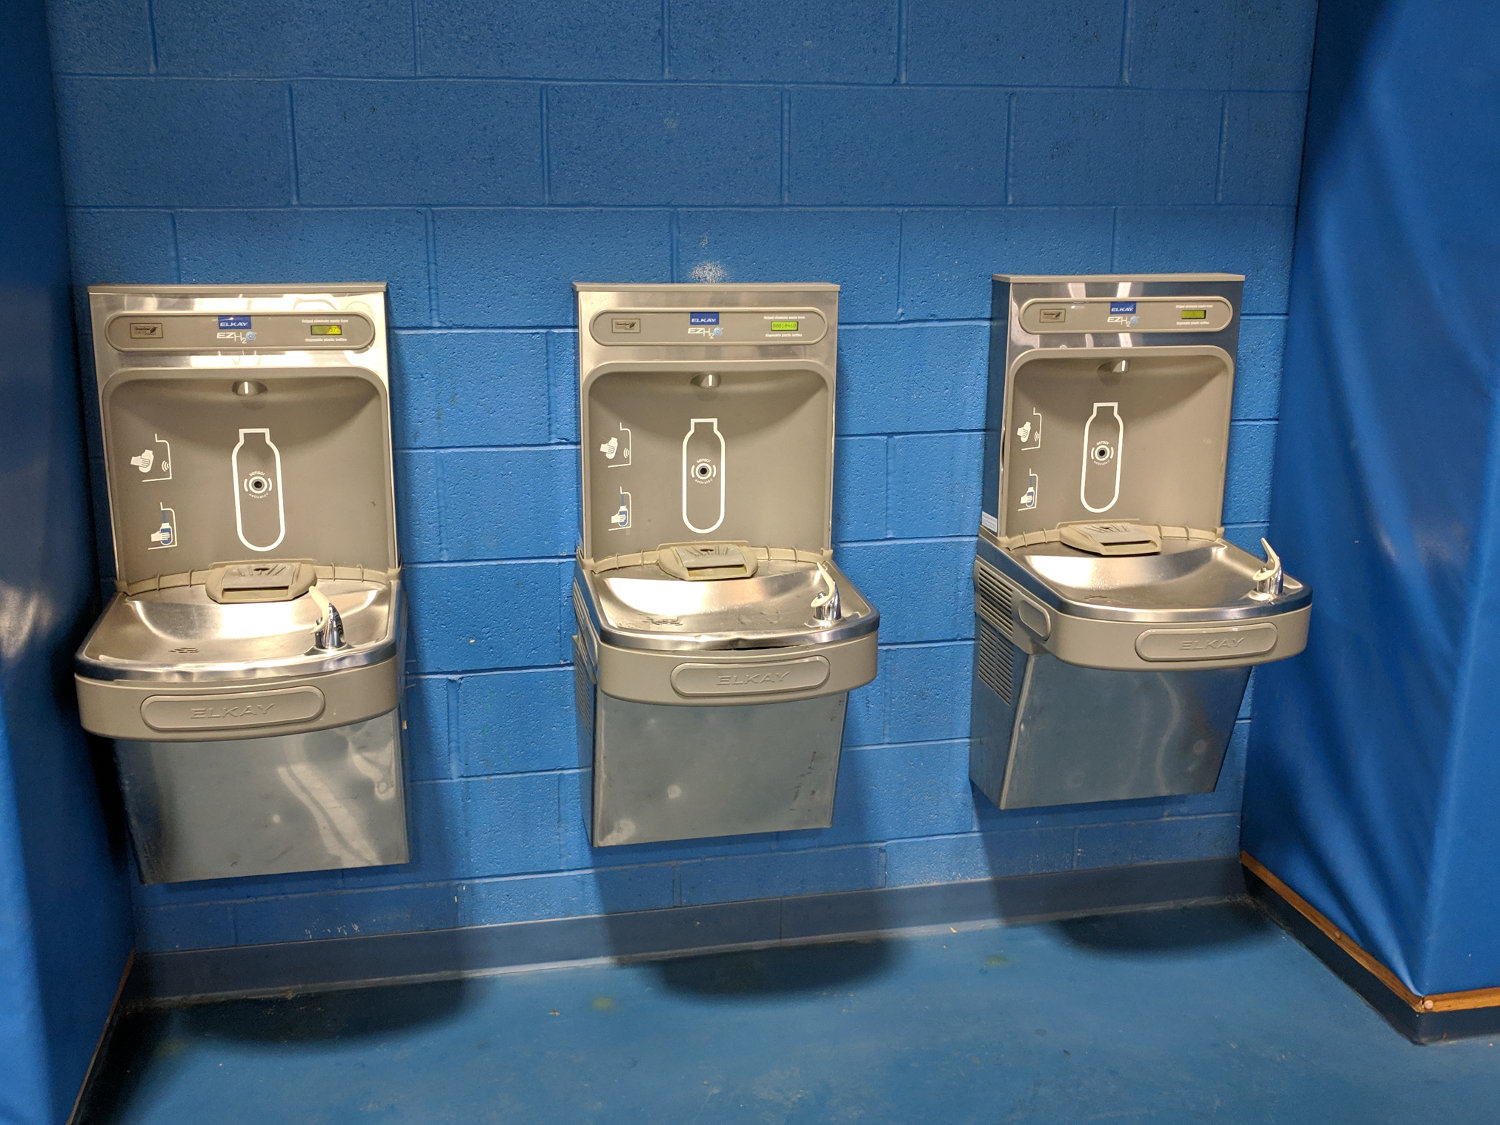
The left display is rotting out:
The center display seems undamaged:

The right display took a direct hit:
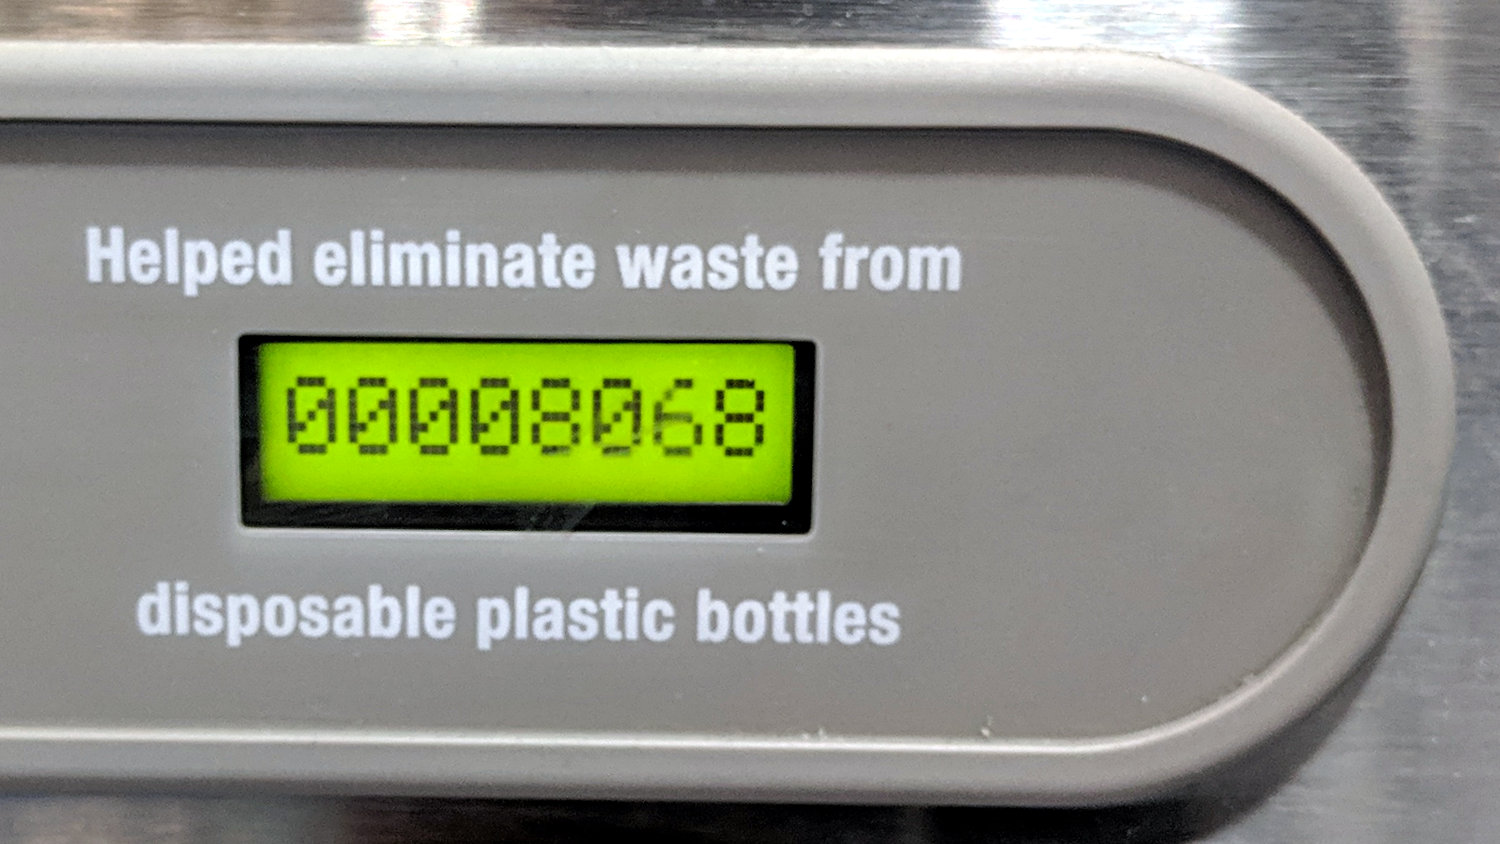
So the middle station refilled 3025 = 10460 – 7435 bottles, roughly eight bottles a day, every day, for a year. Seems like a lot of refilling, doesn’t it?
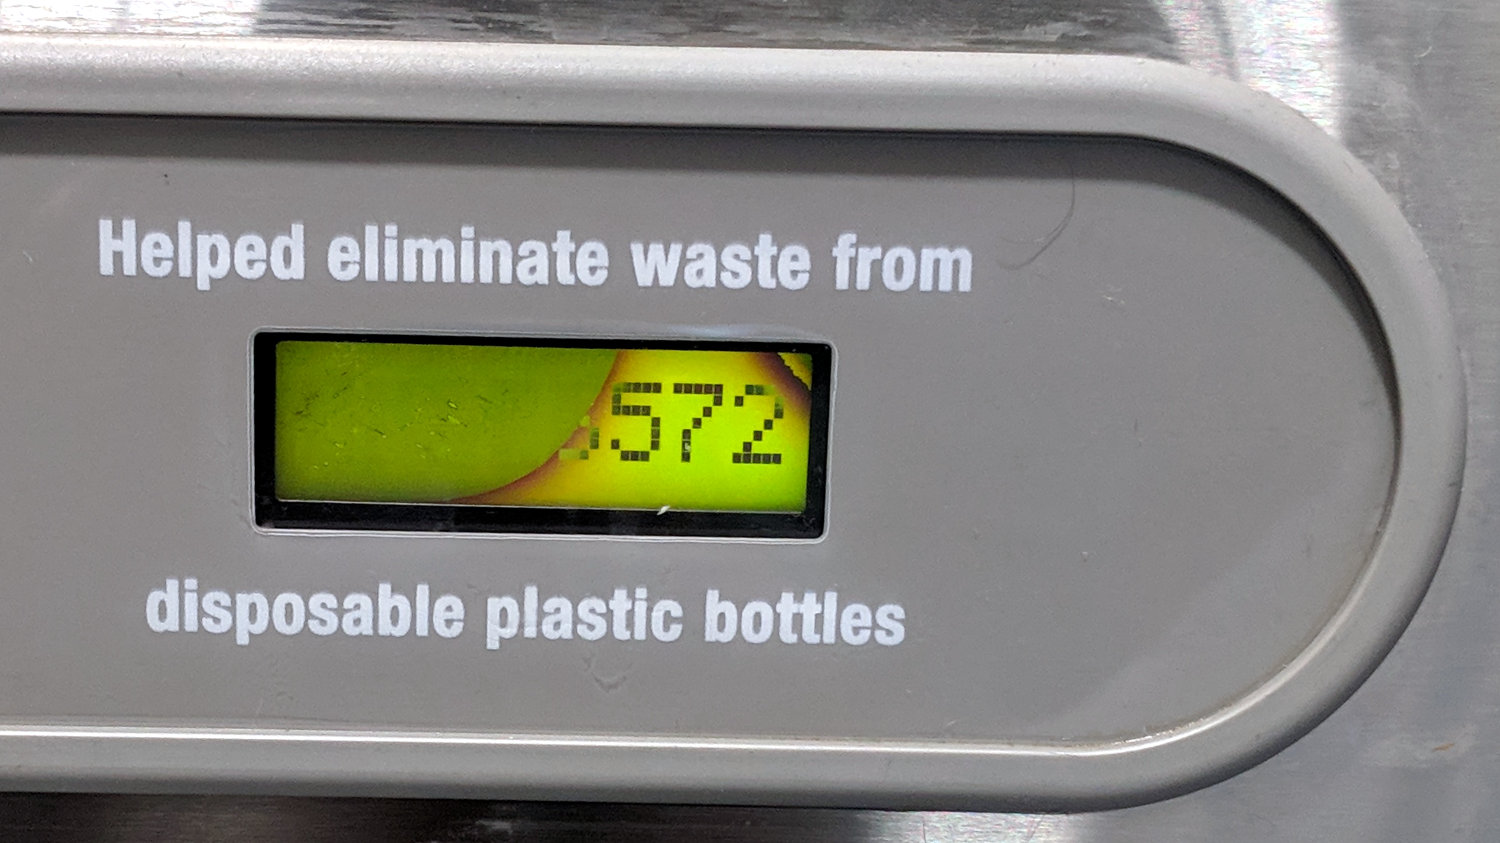
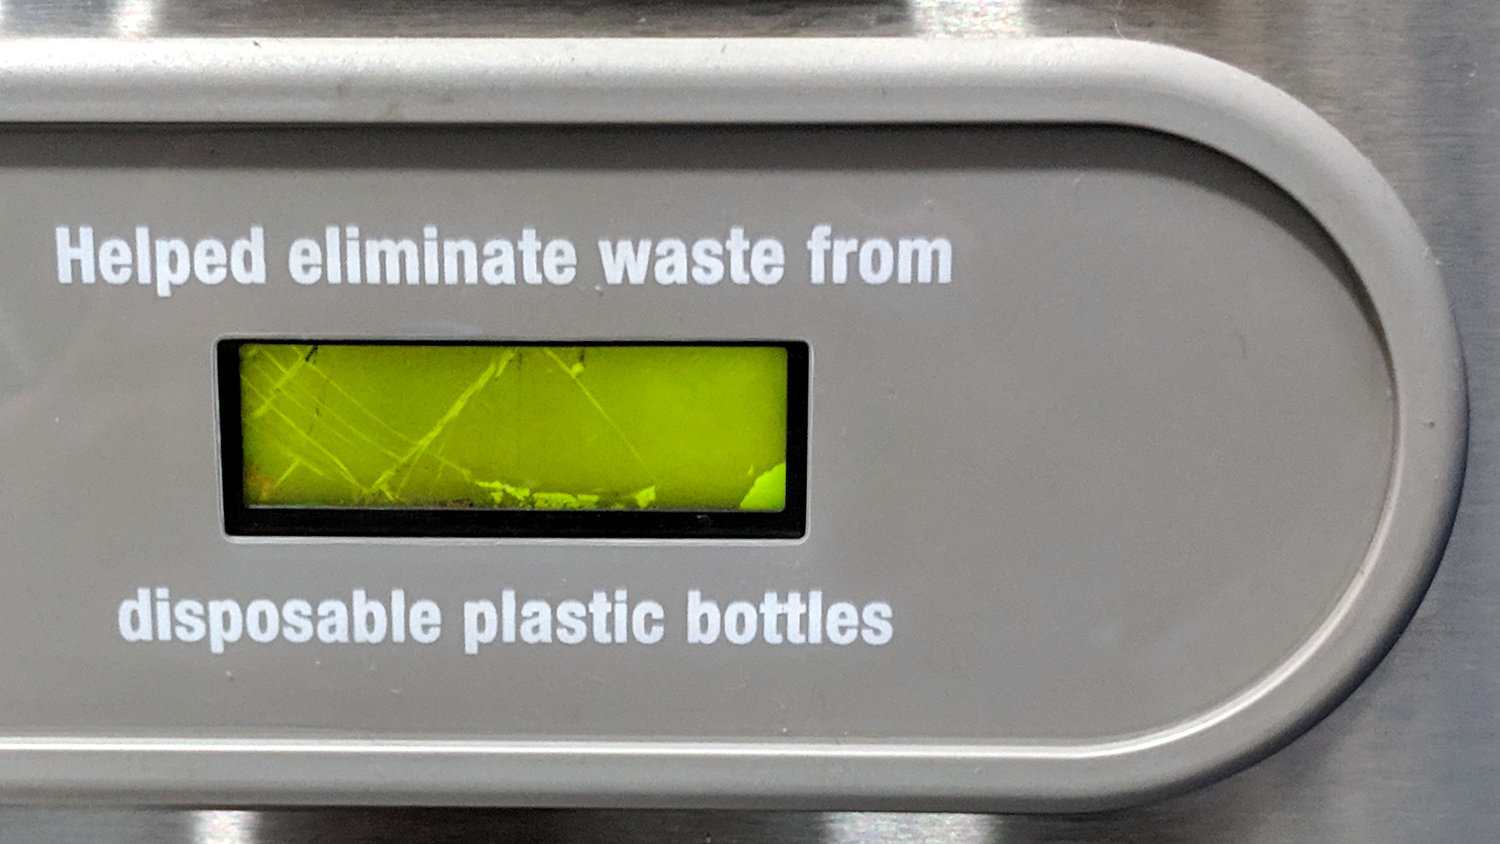
Unfortunately, I didn’t take pictures of the other watering hole last year, but here’s what it looks like now:
Overview:
Left:

Center:
Right:
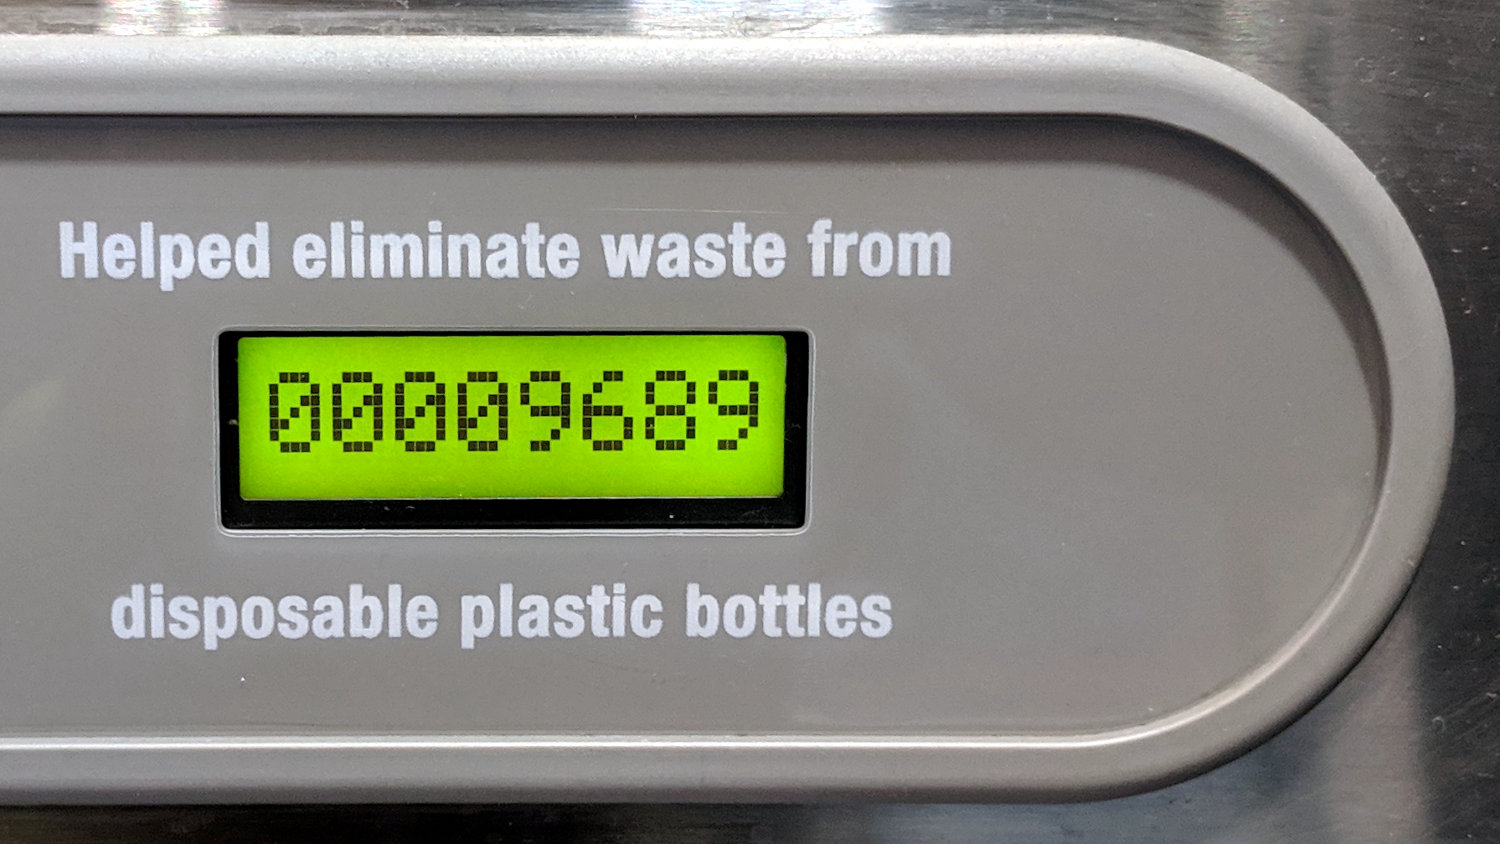
Now, it’s entirely possible I have the two stations reversed, in which case I have numbers for all three displays:
Does a bottle or two a day, every day, for a year, seem more reasonable? Hard to say, so, with a bit of luck, we’ll have more data next year.
For science!
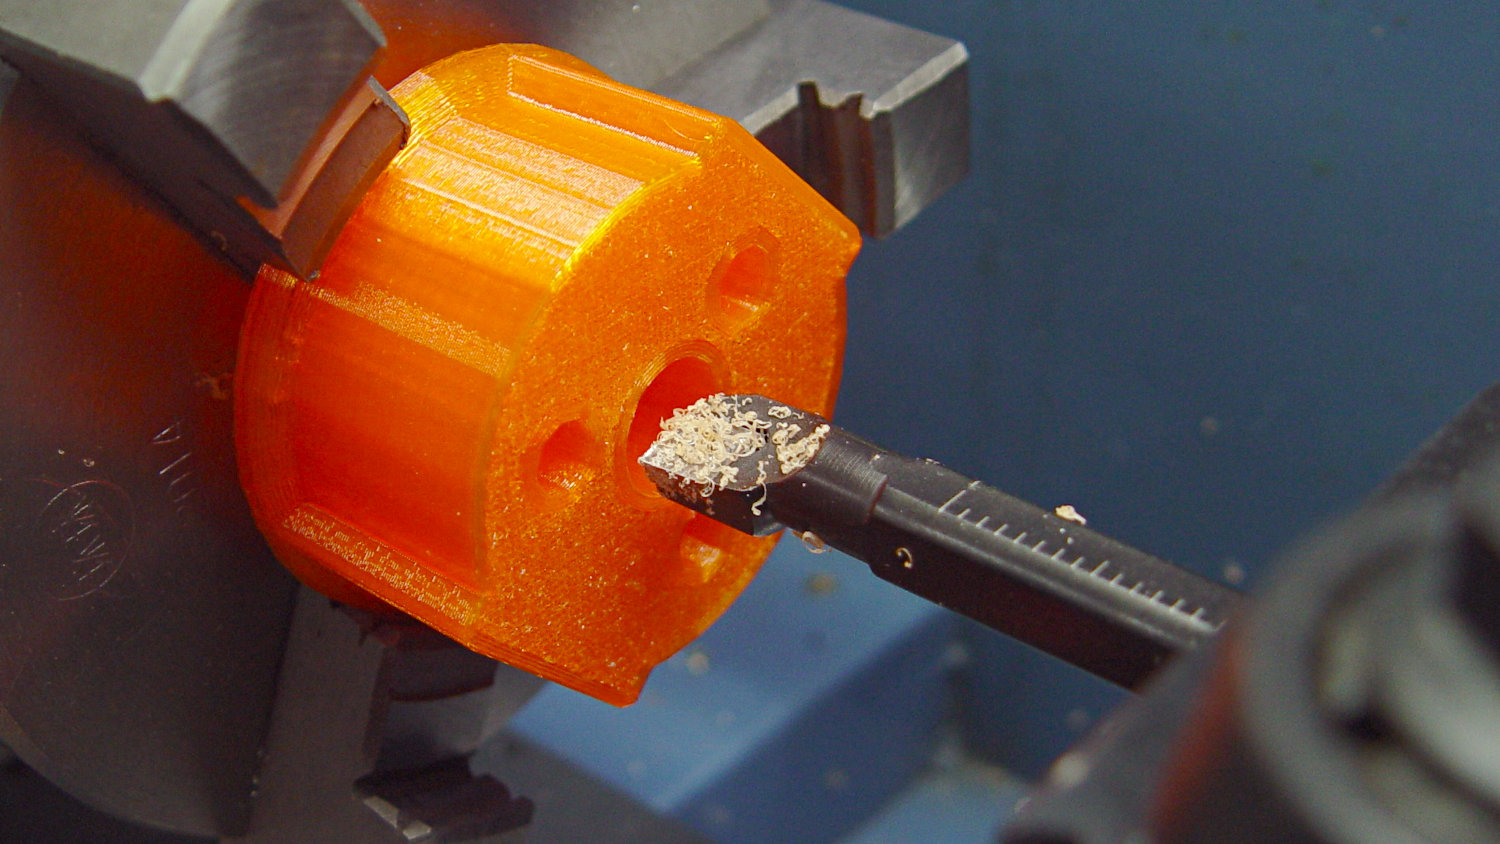
Having reasonable success using a 12 mm hole bored in a 3D printed mount for the nice drag knife holder on the left, I thought I’d try the same trick for the raw aluminum holder on the right side:
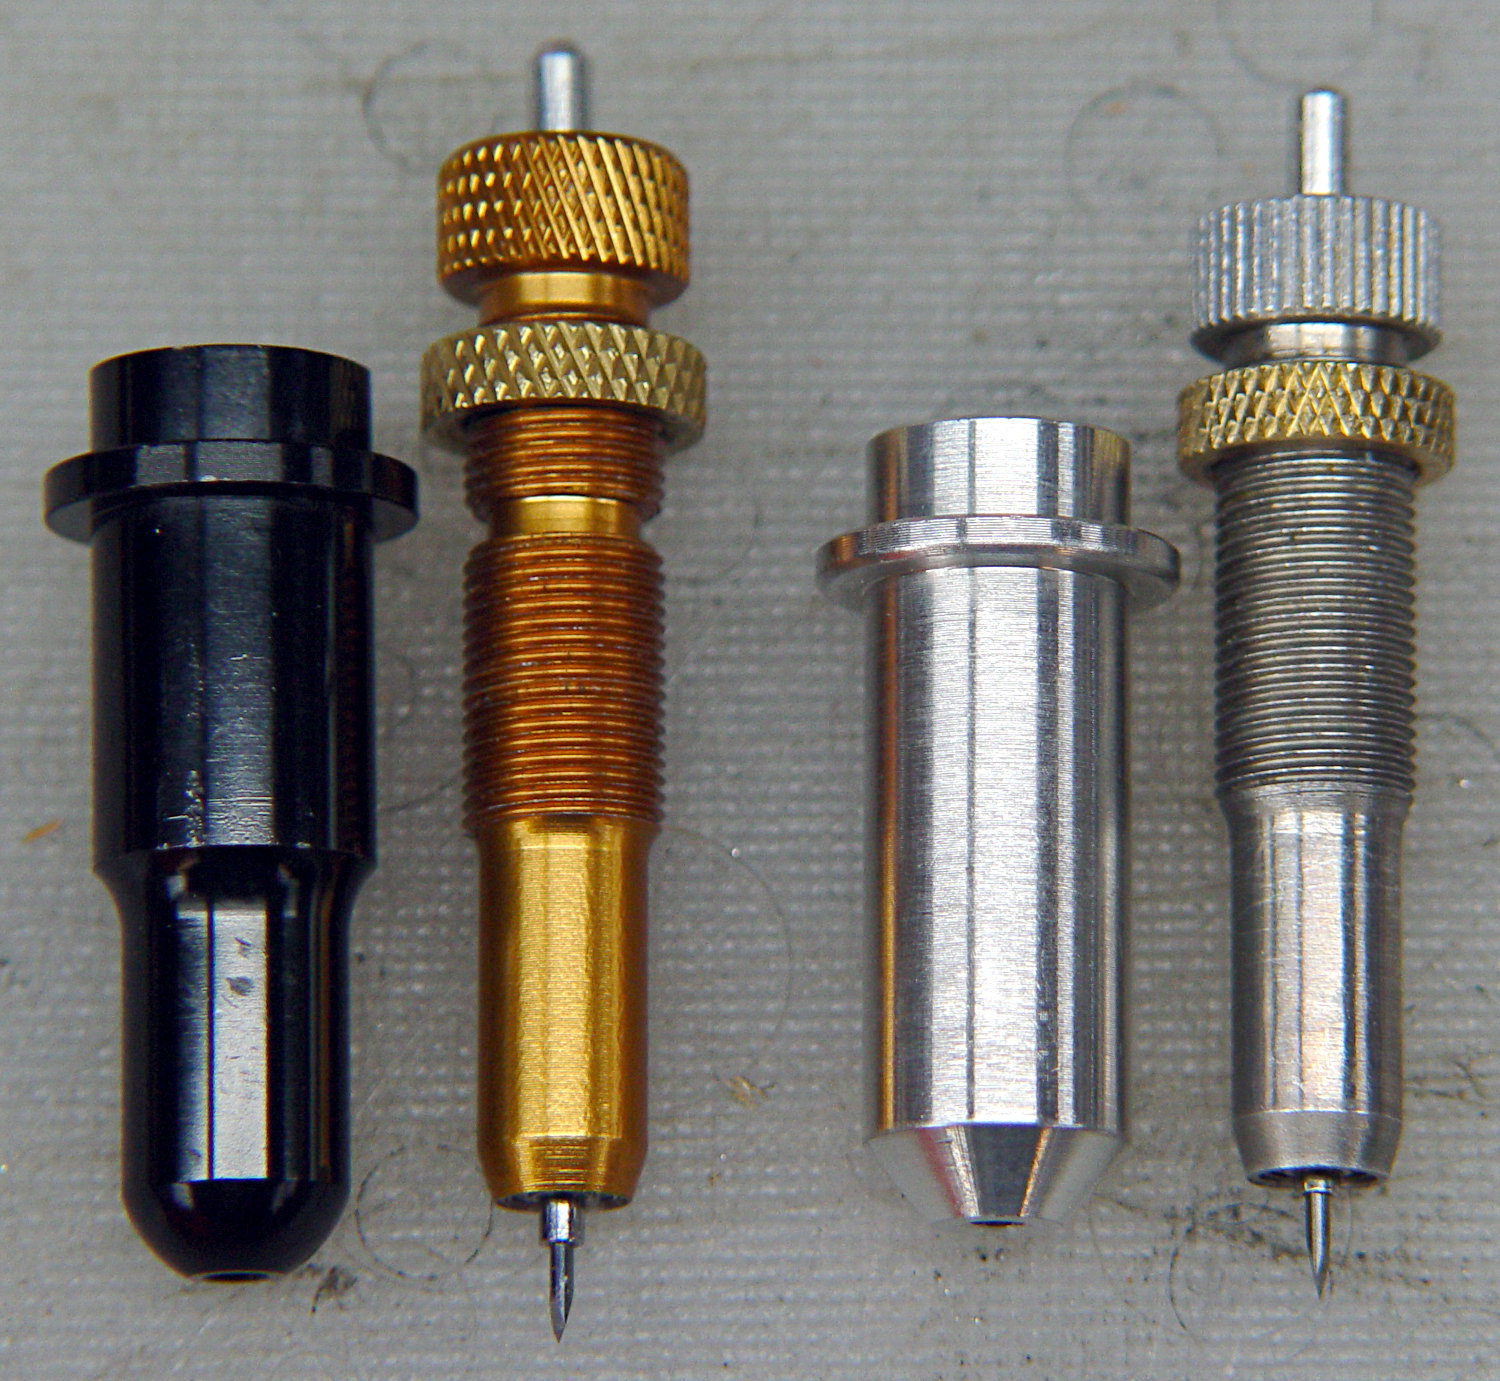
The 11.5 mm body is long enough to justify making a longer holder with more bearing surface:

Slicing with four perimeter threads lays down enough reasonably solid plastic to bore the central hole to a nice sliding fit:
The top disk gets bored to a snug press fit around the flange and upper body:
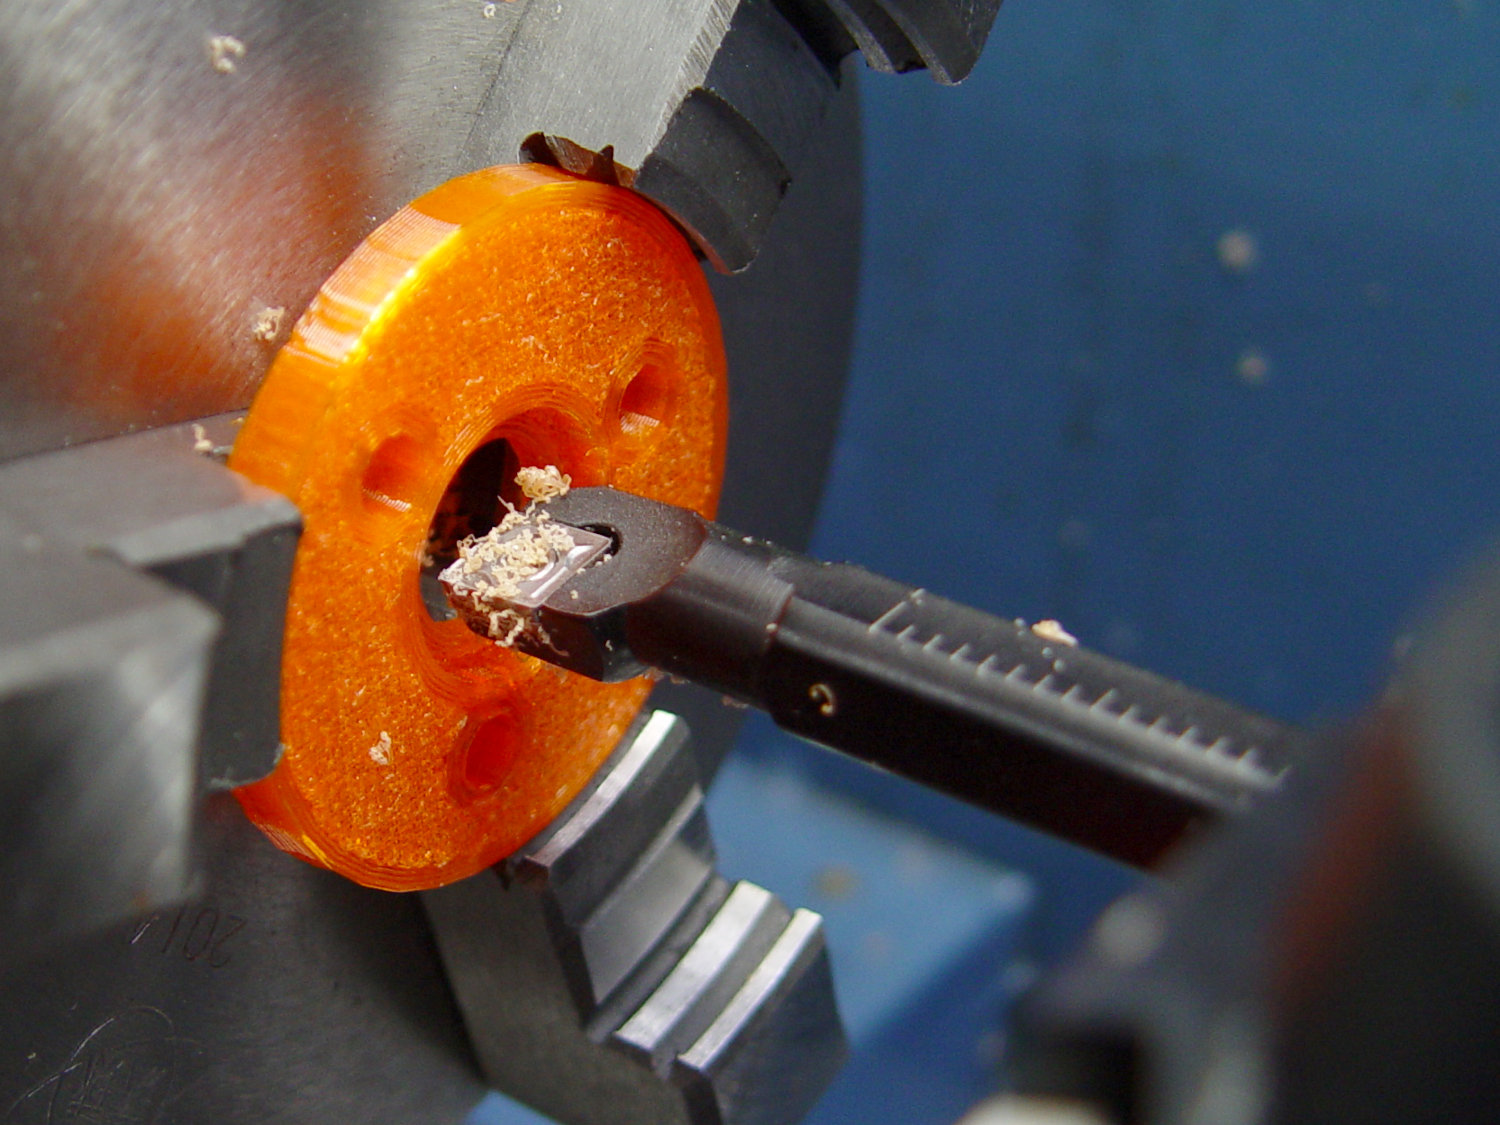
Assemble with springs and it pretty much works:

Unfortunately, it doesn’t work particularly well, because the two screws tightening the MPCNC’s DW660 tool holder (the black band) can apply enough force to deform the PETG mount and lock the drag knife body in the bore, while not being quite tight enough to prevent the mount from moving.
I think the holder for the black knife (on the left) worked better, because:
In any event, I reached a sufficiently happy compromise for some heavy paper / light cardboard test shapes, but a PETG bearing won’t suffice for dependable drag knife cuttery.
Back to the laboratory …
Progress is our most important product:

Now that we’ve begun bicycling more regularly, Winter Bloat is transmogrifying into thigh muscle.
The hills around here become noticeably steeper during winter; we attribute the additional elevation to frost heaves …
We’d been eating a “healthy” high-carb / low-fat diet, which produced the more-or-less expected 1 lb/yr weight gain over the course of three decades. Given that we eat about 106 Cal/yr, being off by a mere 0.3% seemed fixable, but we were always hungry while trying to cut out calories.
In April 2016, we decided our tummies had come between us, so we switched to a mostly ketogenic diet (clicky for more dots):

Having a Master Gardener in the family complicates dietary choices along the ketogenic axis, but Mary raised more green-and-leafy veggies, less squash-and-corn, and we keto-ized our meals reasonably well. Moderation in all things works fine for us, so losing 25 pounds at about 1 lb/week wasn’t particularly stressful.
Continuing through 2017, you can see how regular bike riding season affects winter bloat:

Our cycling vacation in July 2018 produced a blip, but the rest of the riding season worked as expected:
It’s straightforward to crash-diet two dozen pounds, but maintaining a more-or-less stable weight for the next two years suggests we’ve gotten the annual calorie count about right. FWIW, my bloodwork numbers sit in the Just Fine range, apart from the somewhat elevated cholesterol level typical of a keto-ized diet.
Starting in late 2018, however, a stressful situation of a non-bloggable nature (at least for a blog such as this) produced an unusually high number of road trips, motel stays, and generally poor dietary choices:

The situation now being over, our lives / exercise / diet will return to what passes for normal around here and my goal is to lose another 10% of my current body weight, ending at 150 pounds, by the end of the year. In round numbers, that requires losing half a pound = 1700 Cal/week, 250 Cal/day. Not power-noshing an ounce or two of nuts a day should do the trick.
If it makes you feel more science-y, you can use the NIH Body Weight Planner, but it produces about the same answer: knock off 300 Cal to lose weight, 250 Cal to maintain it, at essentially the same exercise level as before.
We’ve been recording our weights as dots on graph paper every Saturday evening for the last four decades, so I know for a fact I averaged 148 pounds when I wore a younger man’s clothes. I’ll re-post the 2019 chart, adding four dots every month, during the rest of the year.
This way, you can help keep me on track … [grin]
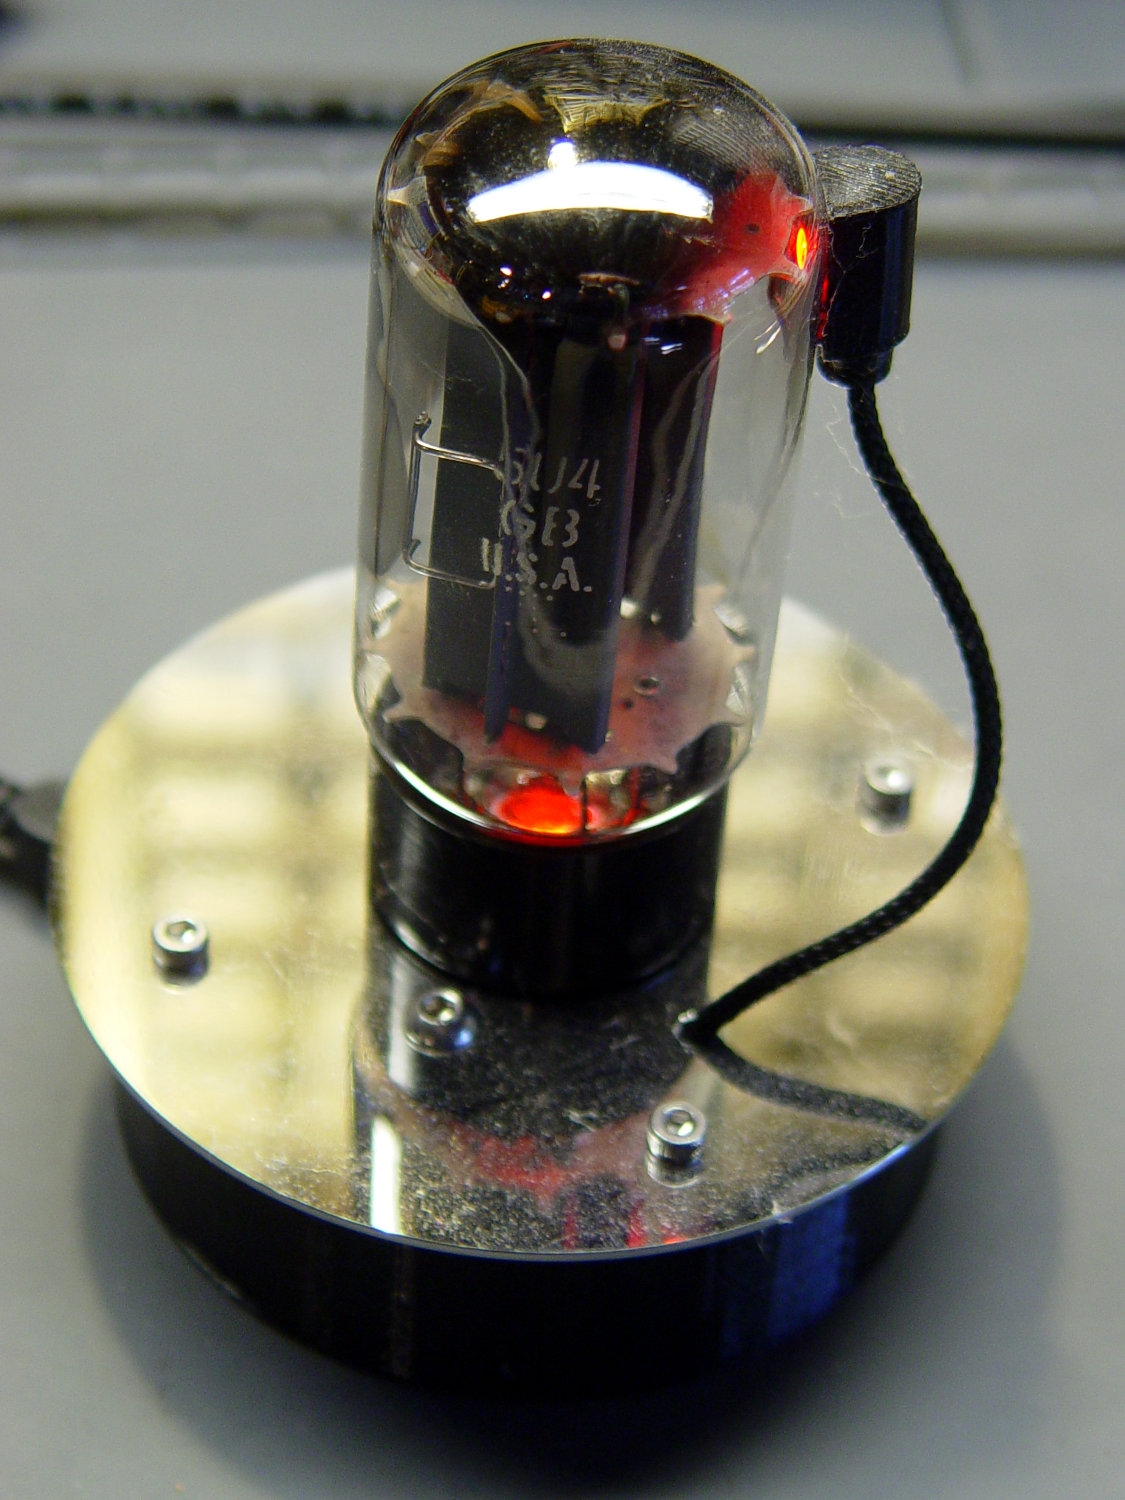
The WS2812 under the 5U4GB full-wave rectifier tube went into pinball panic mode:
It’s been running more-or-less continuously since late 2016, so call it
Because I’d be crazy to replace it with another likely-to-fail WS2812, I had to remove both of them before installing SK6812 RGBW LEDs and updating the Arduino Nano.
Unfortunately, I did a really good job of bonding the side light to the tube with epoxy:

The last tube manufacturing step involved flashing the getter onto the tube envelope, so as to remove the last vestige of air. Admitting air oxidizes the getter:

It was such a pretty tube, too …

