Two years ago, a quartet of new BatMax NP-BX1 batteries performed about as well as could be expected and, by last fall, had deteriorated about as much as expected:

In round numbers, the total capacity declined from 3.25 W·hr to 2.5 W·hr, which means a single battery can’t quite power the camera for the duration of our normal hour-long rides. I do not know what voltage trips the camera’s decision, but the batteries definitely shut down sooner.
So, based on their previous track record, I bought another quartet of Batmax batteries. Being that type of guy, I tested both the old (2020) and new (2022) sets:

The blue traces are the C/D batteries from the as-new tests back in early 2020, the green traces are C/D after two years of use, and the red traces are the “new” quartet after their first charge in the Official BatMax Charger.
It looks very much like BatMax is selling used batteries repackaged as new items, because they are indistinguishable from my used ones. They definitely are not the “Premium Grade A cells” touted in the description.
I returned them for a refund and sent the test results to BatMax; they sent “new replacements” even though I said I would not pay for any future shipments. The batteries had a slightly different wrapper, but the test results were still indistinguishable from used batteries. I offered to return the package and was told that would not be needed.
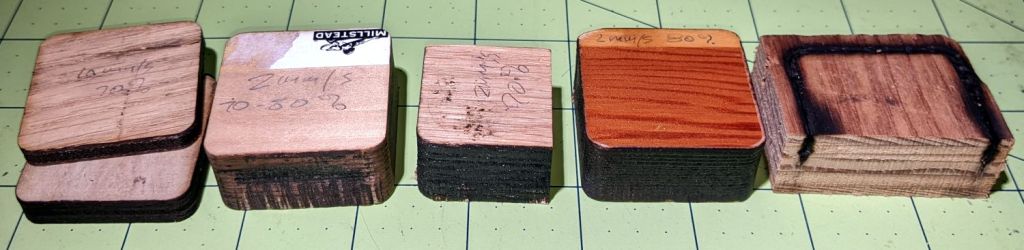
Just a few more batteries for the blinkies.
So I bought a trio of NP-BX1 batteries from Newmowa, an Amazon supplier with a few more vowels than usual, and repeated the exercise:

It seems three good batteries now cost about as much as four crap batteries, under the reasonable assumption chargers are essentially free.
Three batteries isn’t quite enough for my usual rotation and, for unknown reasons, one cannot buy only batteries, so in short order I will have two chargers and six batteries.
The consolidated test results:
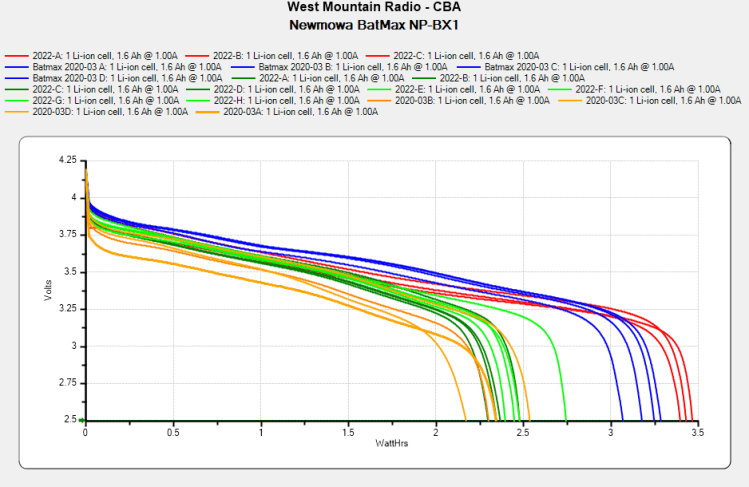
The color code:
- Newmowa: red
- BatMax 2020 new: blue
- BatMax 2020 used: orange
- BatMax 2022 new: green + lime
I stopped writing Amazon reviews after having a few detailed-writeups-with-graphs rejected for the usual unspecified reasons. As the Finn put it, “You wanna download, you know the access code already.”