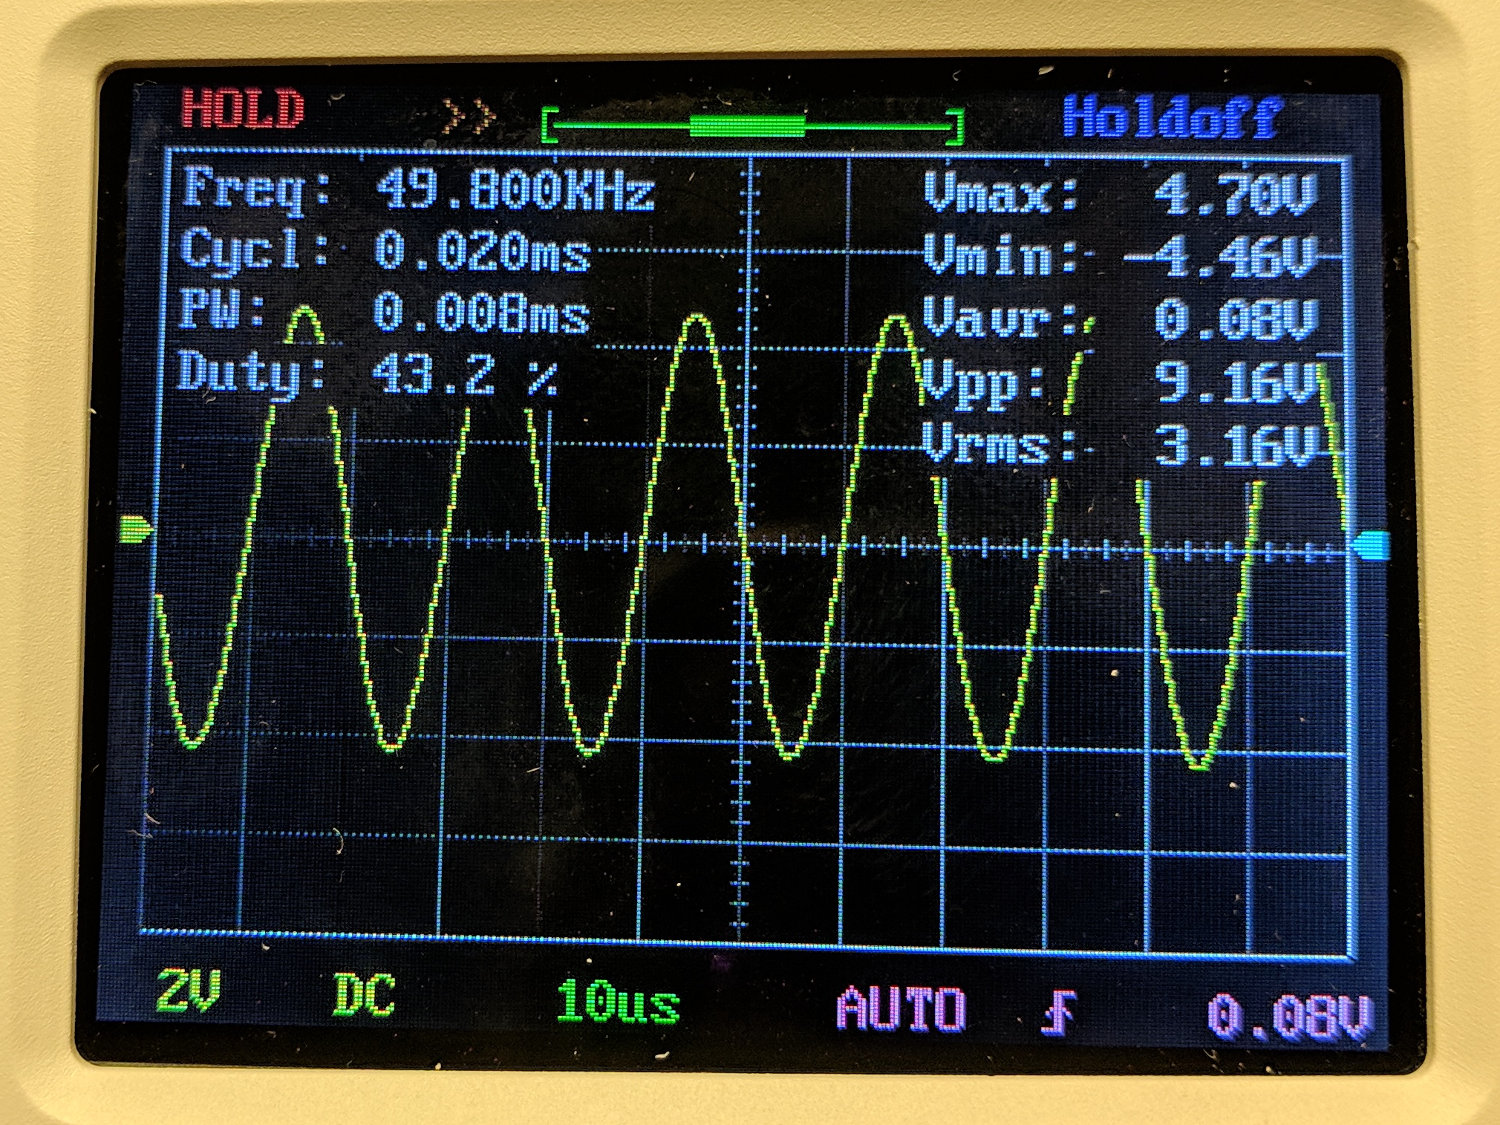
The DSO150 oscilloscope’s specs give a 200 kHz bandwidth, so a 50 kHz sine wave looks pretty good:
A 100 kHz sine wave looks chunky, with maybe 25 samples per cycle:
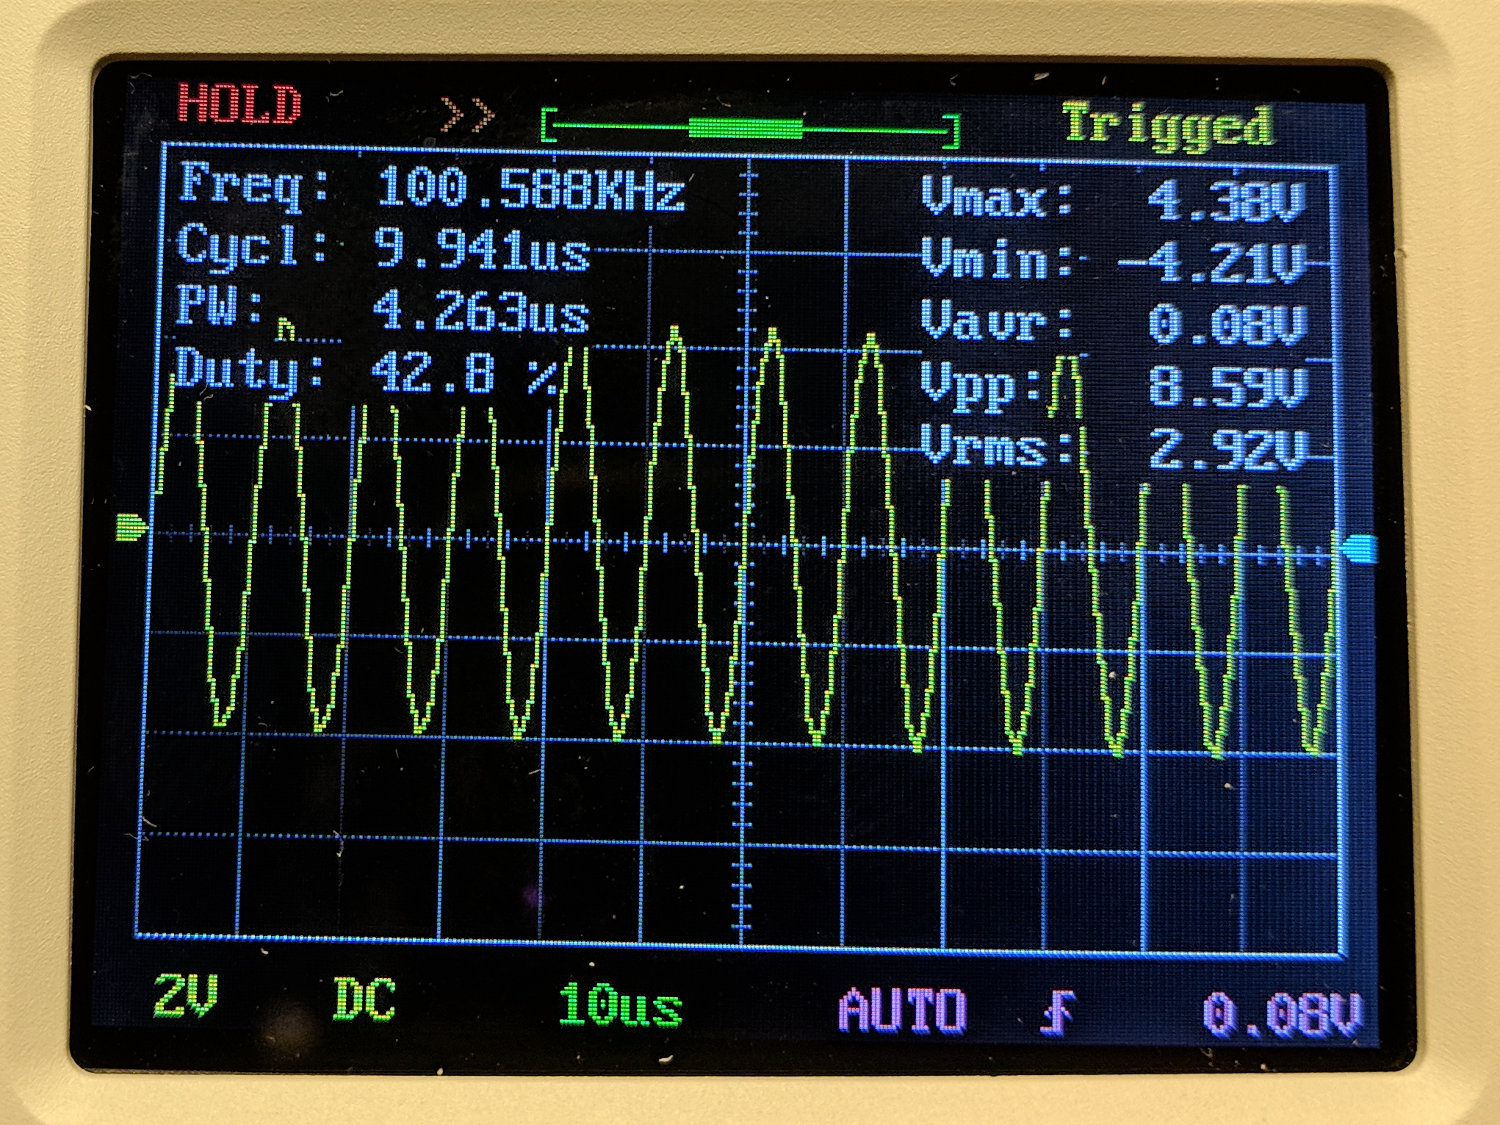
The DSO150 tops out at 10 µs/div, so you can’t expand the waveform more than you see; 25 samples in 10 µs seems to be 2.5 Msample/s, exceeding the nominal 1 Msample/s spec. I have no explanation.
A 10 kHz square wave shows a blip just before each transition that isn’t on the actual signal:

At 50 kHz, there’s not much square left in the wave:

And, just for completeness, a 200 kHz square wave completely loses its starch:

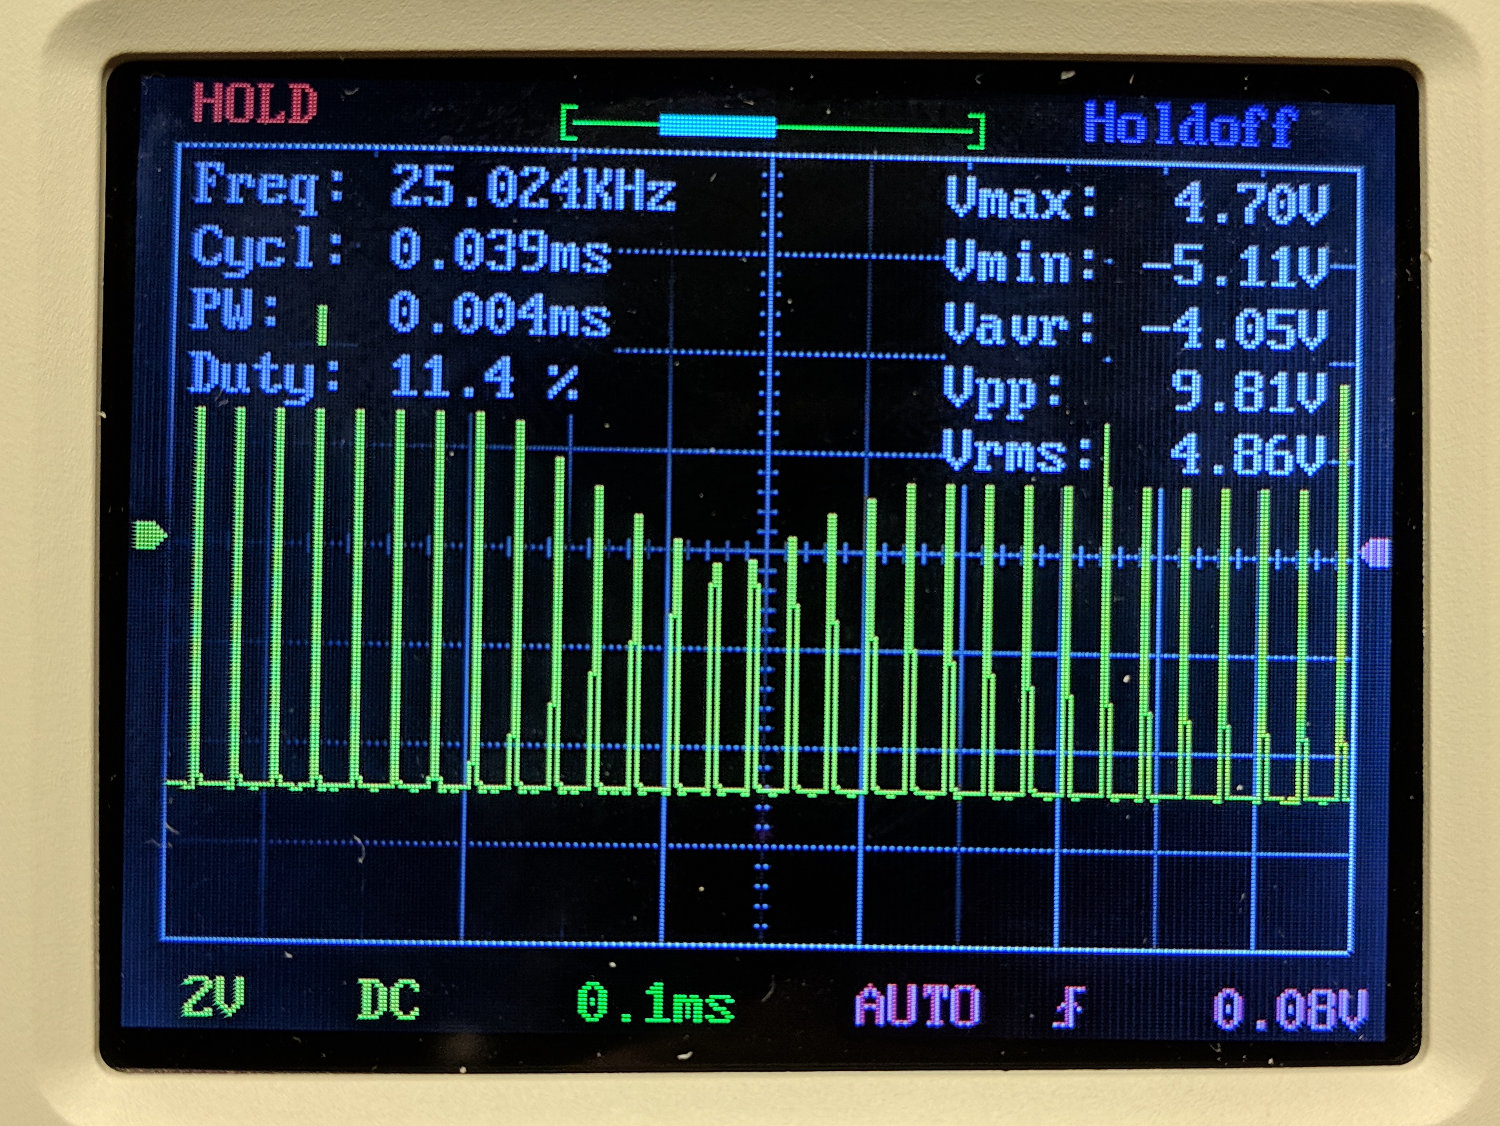
A 10% (-ish) duty cycle pulse at 25 kHz has frequency components well beyond the scope’s limits, so it’s more of a blip than a pulse:

The pulse repetition frequency beats with the scope sampling and sweep speeds to produce weird effects:
Tuning the pulse frequency for maximum weirdness:

None of this is unique to the DSO150, of course, as all digital scopes (heck, all sampled-data systems) have the same issues. The DSO150’s slow sampling rate just makes them more obvious at lower frequencies.
Key takeaway: use the DSO150 for analog signals in the audio range, up through maybe 50 kHz, and it’ll produce reasonable results.
Using it for digital signals, even at audio frequencies, isn’t appropriate, because the DSO150’s low bandwidth will produce baffling displays.

Comments
One response to “JYE Tech DSO150 Oscilloscope vs. Actual Signals”
[…] At least we know the signal lies well within the DSO150’s bandwidth! […]