Ed Nisley's Blog: Shop notes, electronics, firmware, machinery, 3D printing, laser cuttery, and curiosities. Contents: 100% human thinking, 0% AI slop.
The XFCE window manager, at least in its Xubuntu incarnation, seems surprisingly fragile. Every now and again, it won’t start up: all the auto-starting application windows pile atop each other on a single workspace, with no title bar or window decorations, with no way to move them around or change focus. In some cases, the mouse will be active and the keyboard will be dead. This is Not Good.
Rebooting that sucker isn’t productive, as the failure seems to occur most often after a normal system update that, inexplicably, clobbers the window manager’s state information. After that, the window manager will wake up dead every time.
The usual recovery technique involves activating a terminal window and entering xfwm4 --replace to forcibly restart the XFCE window manager, clear the state, and ensure it’s the default. That is remarkably difficult with a nonfunctional keyboard and can’t be accomplished remotely without access to the jammed user’s X session.
What has worked is to SSH in from another PC and delete the XFCE caches for the affected user:
cd ~/.cache
rm -rf xfce4
rm -rf sessions
You can blow away the entire .cache subdirectory if you prefer.
That this should not be necessary goes without saying. Remember that XFCE is currently the least-awful Linux Desktop Environment; all the rest have even greater complexity and much larger problems.
Starting in late 2006, I’ve have several Hobo dataloggers recording the temperature / humidity / light at various locations, under the principle that if you observe something long enough, it turns into science. Regrettably, logging the data is one thing, actually processing it into usable information is entirely another; there’s never a good time for the latter. Perhaps if I break it down into monthly chunks, I can actually make some progress on getting it done.
The first problem is that the Hobo dataloggers lack a convenient user interface: the only way to extract data is through the Hoboware graphical program. Unfortunately, Hoboware stores the extracted data in their proprietary format, locked away from any other program. I eventually discovered the configuration setting that automatically saves the data in CSV format, but I didn’t find that until rather late in the game, didn’t always set it with new versions, and it seems their CSV format has changed slightly over the years. Thus, one of my to-do items is to manually process the remaining Hoboware files to produce the corresponding CSV files, then convert those into a standard format that’s useful with, say, Gnuplot.
The intent is that I can simply concatenate all the CSV data files for a given sensor, run them through a Bash script to sanitize the data, plot what emerges, and then maybe slice-and-dice the data a few different ways. The less manual processing this requires, the more it will get done…
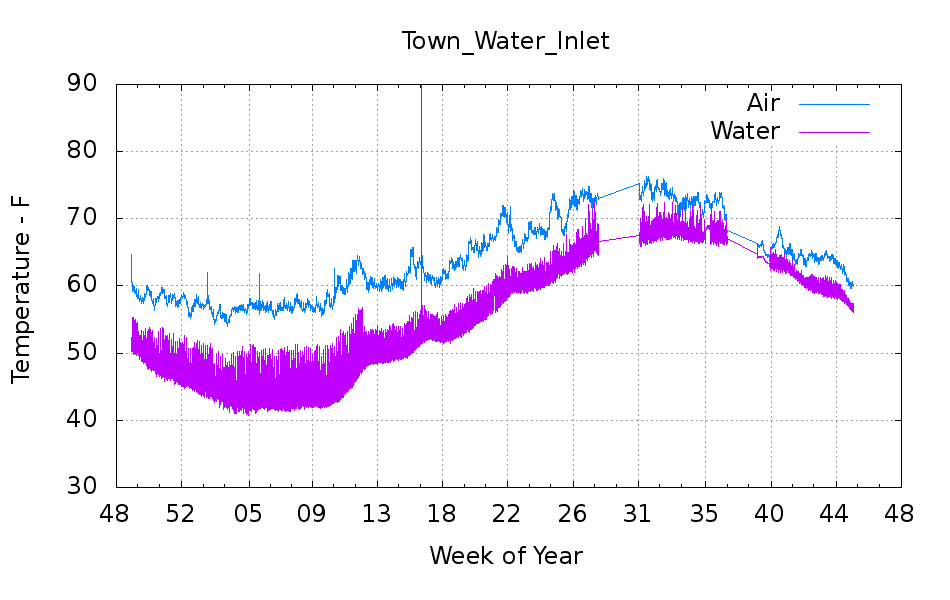
But the first step is to show that something emerges from the data, so here’s the last year of data (recorded in 2012, which includes a bit of 2011 and not quite up to the end of 2012) from the logger that’s been monitoring the air temperature of the Basement Laboratory and the temperature at the house water inlet. I assume the minimum water temperature on the pipe at the basement wall tracks the ground temperature four or five feet down from the surface; more on the hardware behind the data in a while.
Town_Water_Inlet
The fuzz on the purple trace shows the relatively rapid temperature variation as we draw water from the supply: it falls as water moves into the house and rises as still water warms. The inlet always remains cooler than the air temperature, because it’s cemented to the wall, but a closer look (again, in a while) shows a nice exponential curve. The thin straight-line sections show gaps in the data record: sometimes I forget to do my monthly science for a few days or weeks.
An extract from the CSV files, including some data not plotted above:
"Plot Title: Town Water Inlet "
"#","Time, GMT-04:00","Temp, °F","RH, %","Temp, °F","Host Connected","Stopped","End Of File"
1,09/25/2012 09:20:00,66.344,58.707,64.632,,,
2,09/25/2012 09:25:00,66.173,57.579,64.459,,,
-- snippage --
12962,11/09/2012 09:25:00,60.174,54.301,56.685,,,
12963,11/09/2012 09:28:48,,,,Logged,,
12964,11/09/2012 09:28:55,,,,,Logged,Logged
-- snippage --
"Plot Title: Town Water Inlet "
"#","Time, GMT-05:00","Temp, °F()","RH, %()","Temp, °F()","End Of File()"
1,11/09/12 08:35:00 ,64.247,52.282,56.728,
2,11/09/12 08:40:00 ,63.304,51.465,56.728,
-- snippage --
14473,12/29/12 14:35:00 ,56.599,51.454,48.895,
14474,12/29/12 14:40:00 ,56.599,51.485,49.116,Logged
A touch of sed can handle the reformatting I’ve seen so far:
Convert headers to comments: sed 's/^\"/#&/'
Convert non-data events to comments: sed 's/^.*Logged/#&/'
Remove spurious trailing blanks in data fields: sed 's/ ,/,/'
Here’s the Bash and Gnuplot source code that produced the graph, complete with cruft that may come in handy later:
#!/bin/sh
#-- overhead
export GDFONTPATH="/usr/share/fonts/truetype/"
base="${1%.*}"
echo Base name: ${base}
tfile1=$(tempfile)
tfile2=$(tempfile)
ofile=${base}.png
echo Input file: $1
echo Temporary files: ${tfile1} ${tfile2}
echo Output file: ${ofile}
#-- prepare csv Hobo logger file
sed 's/^\"/#&/' $1 > ${tfile1}
sed 's/^.*Logged/#&/' ${tfile1} > ${tfile2}
#-- do it
gnuplot << EOF
#set term x11
set term png font "arialbd.ttf" 18 size 950,600
set output "${ofile}"
set title "${base}"
set key noautotitles
unset mouse
set bmargin 4
set grid xtics ytics
set timefmt "%m/%d/%Y %H:%M:%S"
set xdata time
set xlabel "Week of Year"
set format x "%W"
#set xrange [1.8:2.2]
#set xtics 0,5
#set mxtics 2
#set logscale y
#set ytics nomirror autofreq
set ylabel "Temperature - F"
#set format y "%4.0f"
set yrange [30:90]
#set mytics 2
#set y2label "right side variable"
#set y2tics nomirror autofreq 2
#set format y2 "%3.0f"
#set y2range [0:200]
#set y2tics 32
#set rmargin 9
set datafile separator ","
#set label 1 "label text" at 2.100,110 right font "arialbd,18"
#set arrow from 2.100,110 to 2.105,103 lt 1 lw 2 lc 0
plot	\
    "${tfile2}" using 2:3 with lines lt 3 title "Air", \
    "${tfile2}" using 2:5 with lines lt 4 title "Water"
EOF
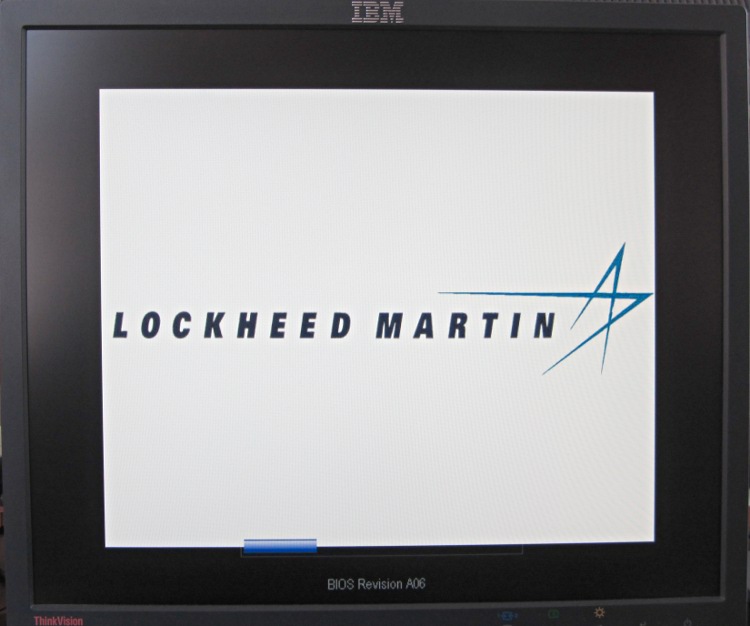
Just got another off-lease Dell, fired it up for the first time, and the BIOS presented this splash screen:
Optiplex 780 BIOS A06 Splash
Updating the BIOS from A06 to A13 restored the default Dell logo, but I really miss having a Genuine Lockheed Martin PC.
The Windows 7 Professional installed on the disk started up in “first time” mode, so they did scrub the drive. It does have RAID enabled, though, which may confuse the Linux installation I have yet to do.
I wish I could put my logo on the BIOS splash screen…
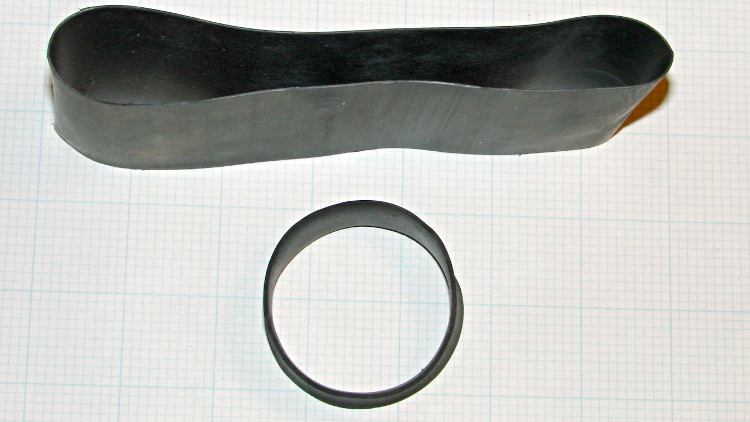
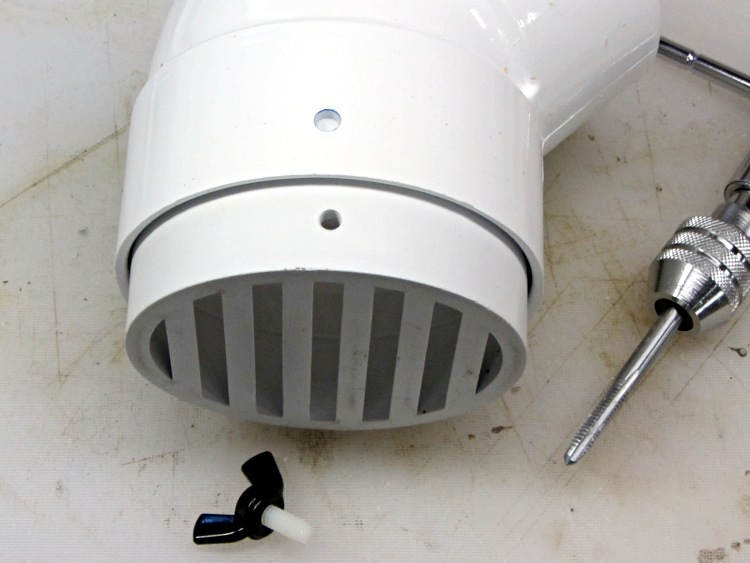
That didn’t matter with a three-foot pipe attached directly to the downspouts, but, as part of the driveway project, I routed the house storm drains and wall footing drain pipes about 20 feet down from the new retaining wall, with the two joining into a single outlet. There’s a cleanout plug on the storm drain line, but the footing drain consists of about 50 feet of corrugated and perforated tubing that would be just about the finest possible chipmunk habitat.
In principle, one would simply glue a grate into the final fitting and be done with it, but leaves from the gutter will pack behind the grate, so it must be removable. Leaving the grate loose means it’ll pop out at the slightest provocation and, most likely, roll another hundred feet down the driveway into the street.
Rather than coping with that, I drilled a clearance hole in the elbow and tapped a matching hole in the grate:
Drain pipe grate – hole tapping
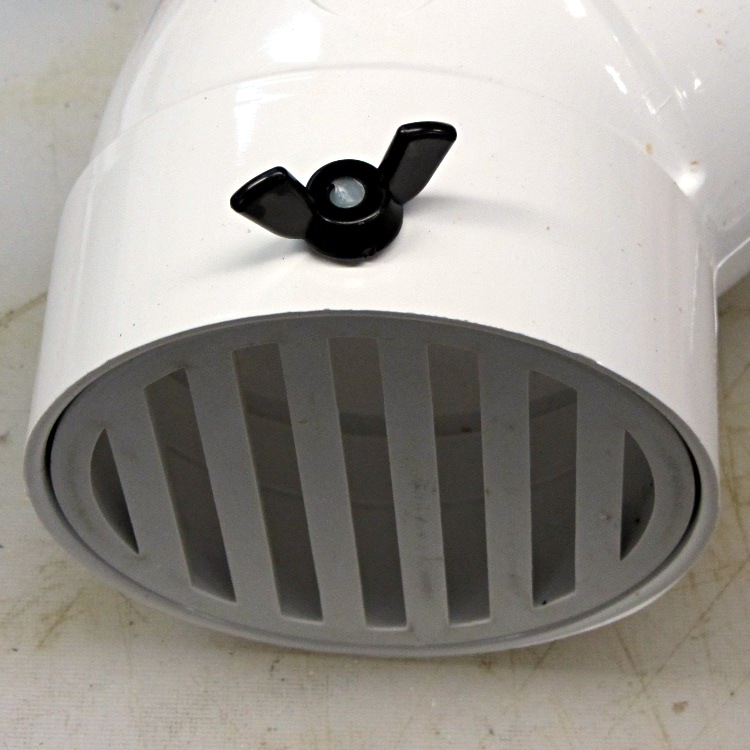
I have a few white nylon 1/4-20 cutoffs from the bike fairing clamps, so I wrecked the threads on one and jammed it into a black nylon thumbscrew:
Drain pipe grate – thumbscrew
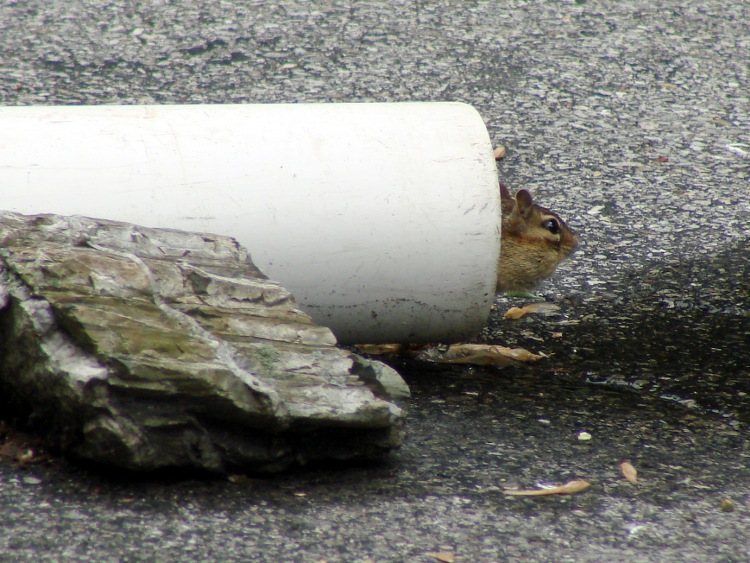
Now, of course, the critters can still climb down the drainpipes from the gutters and set up housekeeping in the plumbing, but I’m not putting grates where I must climb onto the roof to clear them. A chipmunk dropped from two stories will scamper away; I’d never walk again.
The missing link turns out to be assigning a device node with the proper owner, group, and permissions to let saned share the scanner over the network. IIRC, this worked right out of the box in previous versions of Xubuntu, but now requires manual tweakage.
That post gives the steps for my old SCSI scanner. It turns out that the udev rule is not optional for USB scanners… at least not in 12.04, anyway.
In order to build the udev rule, you start with lsusb:
Bus 001 Device 001: ID 1d6b:0002 Linux Foundation 2.0 root hub
Bus 002 Device 001: ID 1d6b:0002 Linux Foundation 2.0 root hub
Bus 003 Device 001: ID 1d6b:0001 Linux Foundation 1.1 root hub
Bus 004 Device 001: ID 1d6b:0001 Linux Foundation 1.1 root hub
Bus 005 Device 001: ID 1d6b:0001 Linux Foundation 1.1 root hub
Bus 006 Device 001: ID 1d6b:0001 Linux Foundation 1.1 root hub
Bus 007 Device 001: ID 1d6b:0001 Linux Foundation 1.1 root hub
Bus 008 Device 001: ID 1d6b:0001 Linux Foundation 1.1 root hub
Bus 002 Device 002: ID 0424:2504 Standard Microsystems Corp. USB 2.0 Hub
Bus 002 Device 005: ID 0d8c:000c C-Media Electronics, Inc. Audio Adapter
Bus 002 Device 006: ID 046d:c52f Logitech, Inc. Wireless Mouse M305
Bus 008 Device 006: ID 04a9:220e Canon, Inc. CanoScan N1240U/LiDE 30
Bus 008 Device 003: ID 413c:1003 Dell Computer Corp. Keyboard Hub
Bus 008 Device 004: ID 413c:2010 Dell Computer Corp. Keyboard
That gives you the bus and device numbers, which means the corresponding device is, at least right now:
/dev/bus/usb/008/006
The udevinfo command I used a while ago has Gone Away, replaced by udevadm with even more syntactic sugar:
udevadm info --query=all --attribute-walk --name=/dev/bus/usb/008/006
Which produces a ton of information, starting with: