Well, it’s actually not “sensing”, but the demo code now sizes the graph to the paper size reported by the plotter, so you can plot on cheap and readily available A-size paper. The Vulcan Nerve Pinch that switches paper size on the fly is Enter+Size; I leave the DIP switches set for B-size sheets, because they’re more impressive and take longer to plot.
A collection of A-size plots:
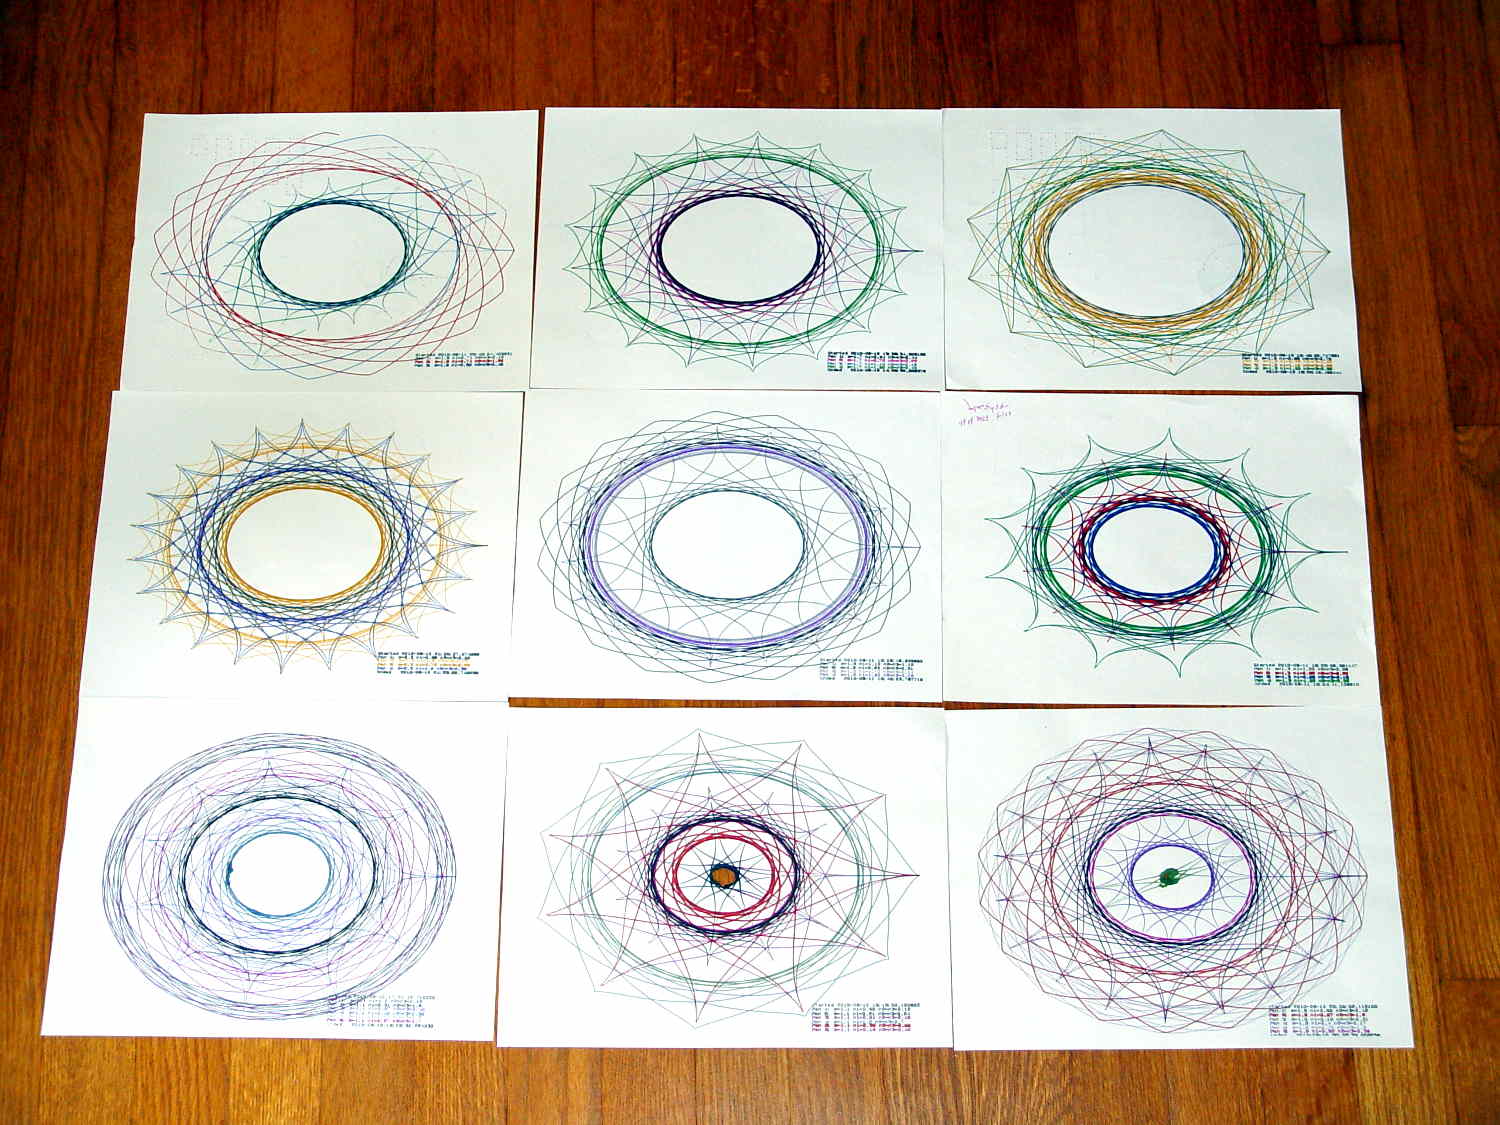
The perspective foreshortening makes the sheets look square and the plots seem circular; they’re not.
The plots lie in rough time sequence from lower left to upper right, showing that I tweaked the n1 parameter to avoid the sort of tiny middle that gnawed a hole right through the center-bottom sheet. I also removed higher m parameter values, because more than 50-ish points doesn’t work well on smaller sheets.
I figured out how to use the Python ternary “operator” and tweaked the print formatting, but basically it’s a hack job through & through.
The Python source code, including the hacked Chiplotle routines that produce the SuperFormula:
from chiplotle import *
from math import *
from datetime import *
import random

def superformula_polar(a, b, m, n1, n2, n3, phi):
   ''' Computes the position of the point on a
   superformula curve.
   Superformula has first been proposed by Johan Gielis
   and is a generalization of superellipse.
   see: http://en.wikipedia.org/wiki/Superformula
   Tweaked to return polar coordinates
   '''

   t1 = cos(m * phi / 4.0) / a
   t1 = abs(t1)
   t1 = pow(t1, n2)

   t2 = sin(m * phi / 4.0) / b
   t2 = abs(t2)
   t2 = pow(t2, n3)

   t3 = -1 / float(n1)
   r = pow(t1 + t2, t3)
   if abs(r) == 0:
      return (0,0)
   else:
 #     return (r * cos(phi), r * sin(phi))
     return (r,phi)


def supershape(width, height, m, n1, n2, n3,
   point_count=10*1000, percentage=1.0, a=1.0, b=1.0, travel=None):
   '''Supershape, generated using the superformula first proposed
   by Johan Gielis.

   - `points_count` is the total number of points to compute.
   - `travel` is the length of the outline drawn in radians.
      3.1416 * 2 is a complete cycle.
   '''
   travel = travel or (10*2*pi)

   ## compute points...
   phis = [i * travel / point_count
      for i in range(1 + int(point_count * percentage))]
   points = [superformula_polar(a, b, m, n1, n2, n3, x) for x in phis]

   ## scale and transpose...
   path = [ ]
   for r, a in points:
      x = width * r * cos(a)
      y = height * r * sin(a)
      path.append(Coordinate(x, y))

   return Path(path)


## RUN DEMO CODE

if __name__ == '__main__':

   plt=instantiate_plotters()[0]
#   plt.write('IN;')

   if plt.margins.soft.width < 11000:               # A=10365 B=16640
       maxplotx = (plt.margins.soft.width / 2) - 100
       maxploty = (plt.margins.soft.height / 2) - 150
       legendx = maxplotx - 2600
       legendy = -(maxploty - 650)
       tscale = 0.45
       numpens = 4
       m_list = [n/10.0 for n in [11, 13, 17, 19, 23]];   # prime/10 = number of spikes
       n1_list = [n/100.0 for n in range(55,75,1) + range(80,120,5) + range(120,200,10)]  # ring-ness 0.1 to 2.0, higher is larger
   else:
       maxplotx = plt.margins.soft.width / 2
       maxploty = plt.margins.soft.height / 2
       legendx = maxplotx - 3000
       legendy = -(maxploty - 700)
       tscale = 0.45
       numpens = 6
       m_list = [n/10.0 for n in [11, 13, 17, 19, 23, 29, 31, 37, 41, 43, 47, 53, 59]];   # prime/10 = number of spikes
       n1_list = [n/100.0 for n in range(15,75,1) + range(80,120,5) + range(120,200,10)]  # ring-ness 0.1 to 2.0, higher is larger

   print "Max: ({},{})".format(maxplotx,maxploty)

   n2_list = [n/100.0 for n in range(10,50,1) + range(55,100,5) + range(110,200,10)]  # spike-ness 0.1 to 2.0, lower is spiky

   plt.write(chr(27) + '.H200:')   # set hardware handshake block size
   plt.set_origin_center()
   plt.write(hpgl.SI(tscale*0.285,tscale*0.375))    # scale based on B size characters
   plt.write(hpgl.VS(10))                           # slow speed for those abrupt spikes

   plt.select_pen(1)                                # standard loadout has pen 1 = black
   plt.write(hpgl.PA([(legendx,legendy)]))
   plt.write(hpgl.LB("Started " + str(datetime.today())))
   m = random.choice(m_list)

   pen = 1
   for n1, n2 in zip(random.sample(n1_list,numpens),random.sample(n2_list,numpens)):
    n3 = n2
    print "{0} - m: {1:.1f}, n1: {2:.2f}, n2=n3: {3:.2f}".format(pen,m,n1,n2)
    plt.select_pen(pen)
    plt.write(hpgl.PA([(legendx, legendy - 100*pen)]))
    plt.write(hpgl.LB("Pen {0}: m={1:.1f} n1={2:.2f} n2=n3={3:.2f}".format(pen,m,n1,n2)))
    e = supershape(maxplotx, maxploty, m, n1, n2, n3)
    plt.write(e)
    pen = pen + 1 if (pen % numpens) else 1

   plt.select_pen(1)
   plt.write(hpgl.PA([(legendx, legendy - 100*(numpens + 1))]))
   plt.write(hpgl.LB("Ended   " + str(datetime.today())))
   plt.select_pen(0)

Comments
5 responses to “HP 7475A Plotter: SuperFormula With Paper Size Sensing”
[…] and scribbled a few feet to get it started again. It left a good-enough trace, so I ran an A-size plot with the ball pen, two liquid ink pens, and a refilled ceramic […]
[…] now, I have half a dozen baggies each containing half a dozen plotter pens, plus a demo program that can produce good-looking Superformula plots, so I can do this without any […]
[…] Each operation transfers 128 MB (128 x 220 = 131 x 106) bytes. The variations probably come from other stuff going on, most notably the USB-to-serial adapter driving the plotter while I’m testing a tweak to the Superformula demo code. […]
[…] can’t change the new plot’s paper size, because the digitizing command preempts the Enter button that’s part of the Enter+Size […]
I absolutely love it