Prompted by that comment, a bit more data emerges.
This unsteady ziggurat barely supports the aluminum CPU heatsink atop a PC CPU exhaust duct; the two came from different PCs and have no relation to each other. The vise in the background keeps the whole affair from falling over. The fan sucks air through the heatsink and exhausts it out the front.
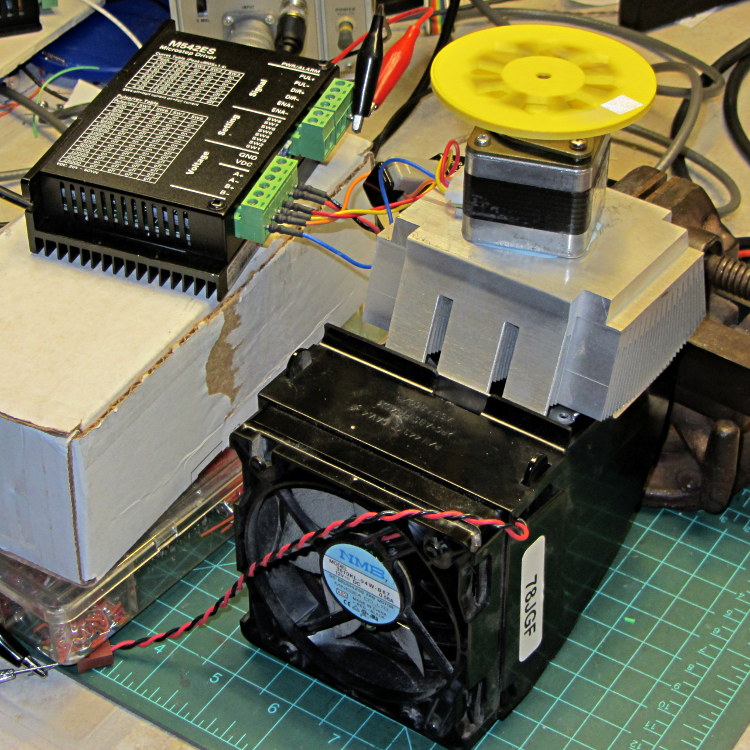
Throughout all this, the stepper driver runs at a bit over 10 k step/sec, tuned to avoid the howling mechanical resonances in that stack. At 1/8 microstepping, that’s 6.25 rev/s = 375 RPM, which would drive the Thing-O-Matic at 210 mm/s and the M2 at 225 mm/s. Your speed will vary, of course, depending on the pulley diameter / number of teeth / belt pitch, etc.
Under the same conditions as before (i.e., no thermal compound, fan off), the stepper stabilized at 143 °F = 62 °C in the 57 °F = 14 °C Basement Laboratory ambient, with 1.91 A peak current (I don’t believe that second decimal place, either) and a 6.6 °C/W case-to-ambient coefficient. That’s close enough to the 63 °C and 6.7 °C/W coefficient from the earlier test, so the conditions seem roughly the same.
Smoothing a thin layer of heatsink compound on the butt of the motor, then squishing it firmly atop the heatsink, cut the temperature to 130 °F = 53 °C without the fan. That suggests the case-to-ambient coefficient is now 5.3 °C/W: the thermal compound helps by 1.3 °C/W.
Turning on the fan drops the case temperature to 84 °F = 29 °C, which works out to a coefficient of 2.1 °C/W. Obviously, moving air over that heatsink helps the cooling a lot: the heatsink felt cold to the touch and the motor case was barely warm.
Increasing the current to 2.37 A dissipates 11.2 W, which would be scary without the heatsink and air flow. The temperature stabilized at 91 °F = 33 °C, for a coefficient of 1.7 °C/W.
At 2.83 A = 16 W, the temperature rises to 100 °F = 38 °C, with a coefficient of 1.5 °C/W. While it’s not unstoppable with that much current, the motor has plenty of torque! The motor becomes pleasantly warm, the heatsink stays just above cool, and all seems right with the world. I suspect the windings get a bit toasty in there, but they can’t possibly be worse off than inside a case at boiling-water temperatures.
Using the original insulated-motor coefficient of 19 °C/W, 16 W would cook the motor at 320 °C. Perhaps the case would make a nice extruder heater after it stopped being a motor?
[Update: See the comments for the results of just blowing air over the motor case.]