Ed Nisley's Blog: Shop notes, electronics, firmware, machinery, 3D printing, laser cuttery, and curiosities. Contents: 100% human thinking, 0% AI slop.
Category: Science
If you measure something often enough, it becomes science
The HP 7475A plotter spec calls for 19 g = 0.67 oz of downward force on the pen, so, in an ideal world, one might want to use one’s collection of aging plotter pens in a similar manner.
Plotter pen, meet digital scale:
MPCNC – Plotter pen force test
Stepping the pen downward in 0.1 mm increments produced a set of numbers and a tidy linear fit graph:
MPCNC Plotter Pen Holder – Spring Constant
I hereby swear I’m not making things up: the spring constant really is a nice, round 100 g/mm!
I set plot_z = -1.0 in the GCMC program, with Z=0.5 touched off atop a defunct ID card on the paper surface to compensate for any tabletop warp / bow / misalignment, plus any errors from the tool length probe. An eyeballometric scan against a straightedge shows pretty nearly no misalignment, which means the holder mashes the pen against the paper with about 100 g of force, five times the HP spec.
A distinct case of pen abuse rears its ugly head.
It’s time to conjure a height probe for the tool holder.
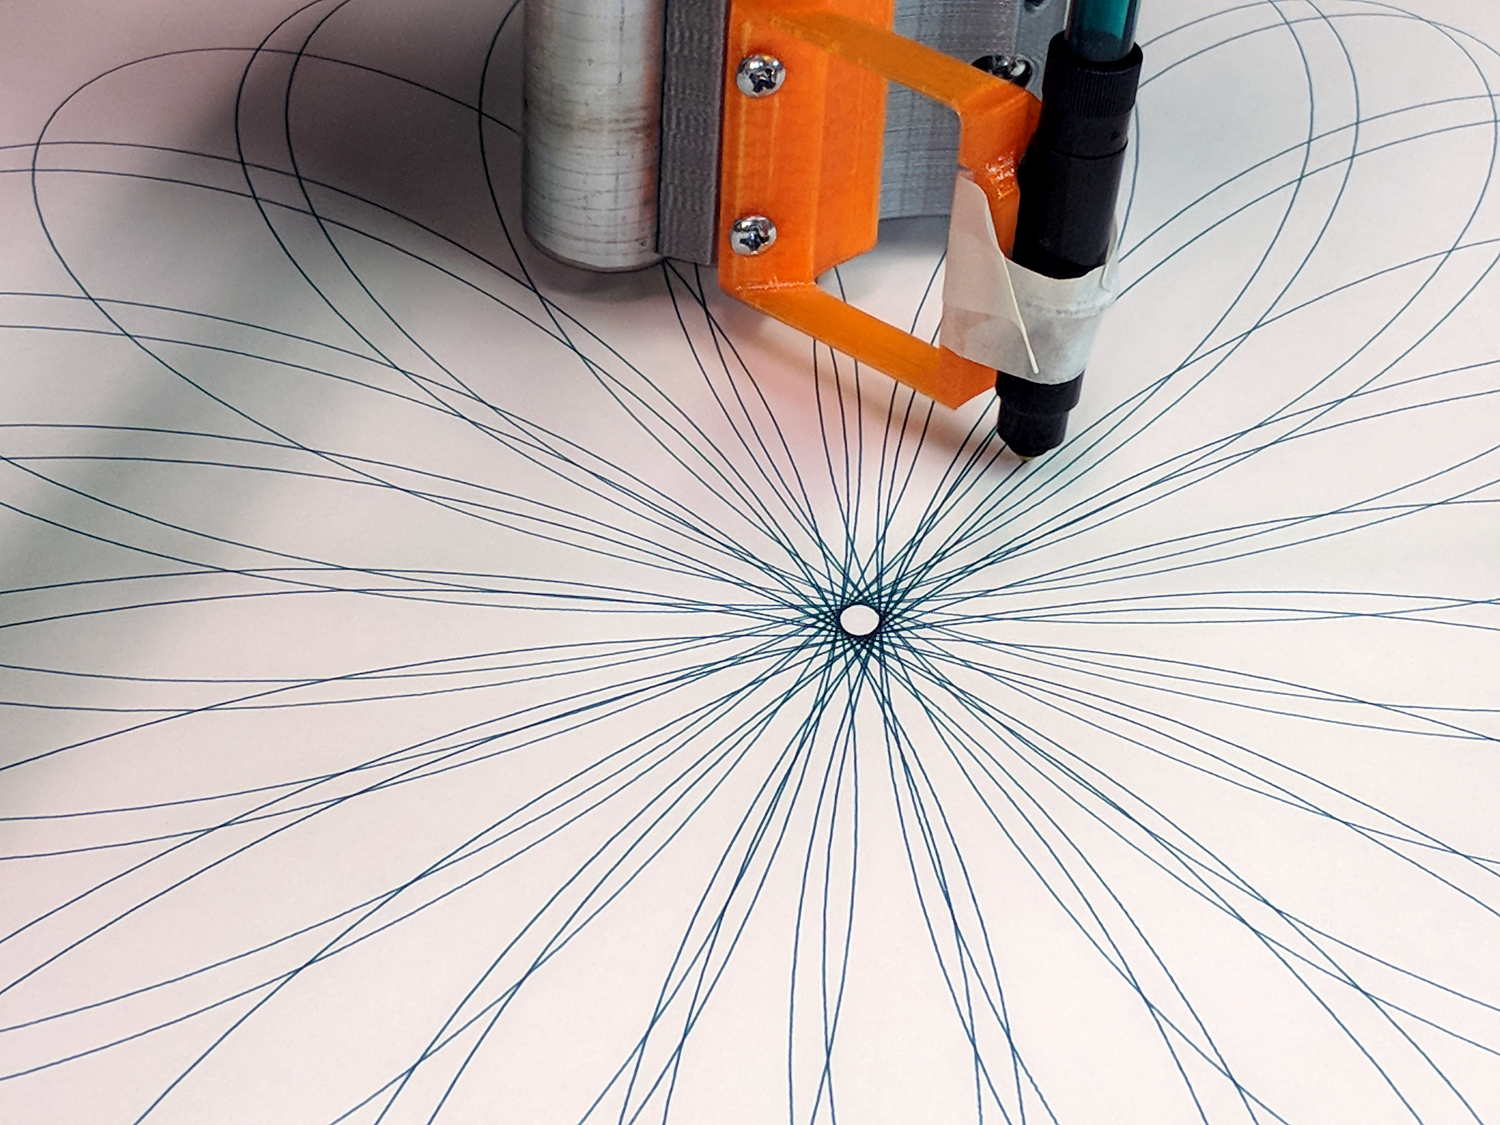
The GCMC Spirograph Generator program chooses parameters using pseudo-random numbers based on a seed fed in from the Bash script, so I was surprised to see two plots overlap exactly:
Overlaid pattern – G-Code simulator
The two overlapping traces are the 15 inward-pointing wedges around the central rosette.
The Offset isn’t quite the same, but the pen width covers up the difference.
With only four Stators and 17 Rotors, the probability of picking the same pair works out to 0.25 × 0.059 = 1.4%. You can sometimes get the same number of Lobes and Turns from several different Stator + Rotor combinations, but these were exact matchs with the same indices.
The Pen Offset within the Rotor comes from a fraction computed with ten bit resolution, so each Offset value represents slightly under 0.1% of the choices. If any four adjacent values look about the same, then it’s only eight bits of resolution and each represents 0.4%.
The Rotor and Stator set the Diameter ratio, but the sign comes from what’s basically a coin flip based on the sign of a fraction drawn from 256 possibilities; call it 50%.
Overall, you’re looking at a probability of 28 ppm = 0.0028%, so I (uh, probably) won’t see another overlay for a while …
I don’t know how to factor the PRNG sequence into those numbers, although it surely affects the probability. In this case, two different seeds produced nearly the same sequence of output values, within the resolution of my hack-job calculations.
Whatever. It’s good enough for my simple purposes!
The previous times we slow-roasted a pork shoulder, the smoke alarm went off well before the skin crisped. We’d drained the drippings from the pan before crisping the skin, but the residue still smoked up a storm; this time we we left the pool in place to see if it kept the surface cooler and reduced the smoke.
Well, no, it didn’t. This happened in the five minutes between one rotation and the next:
Roast Pork Shoulder – Smoked Kitchen
Knowing things would get at least a little smoky, I’d closed the pocket door (on the left) and hung a beach towel across the opening into the laundry room (to the right), which kept most of the smoke out of the rest of the house. The smoke detector in the laundry room didn’t go off until I walked through the towel, so my precautions worked pretty well.
Wow, was that skin crispy:
Roast Pork Shoulder – Crispy Skin
Plenty of smoke and no fire; the roasting pan has narrow slits for that very reason. Took a couple of hours to vent the house, during which the yard smelled downright yummy.
Next time, we’ll plunk the roast on a lined cookie sheet (with a rim!) and see what happens.
The big spike over on the left at 125.000 MHz comes from the Ham-It-Up local oscillator. A series of harmonics starting suspiciously close to 125.032768 kHz produces the oneat 125.066 MHz, just to the right of the WWVB signal, which leads me to suspect a rogue RTC in the attic.
There is, in fact, a free running “Test Signal Source” on the Ham-It-Up board:
Ham-It-Up Test Signal source – schematic
Although I have nary a clue about that bad boy’s frequency, measuring it and cutting the inverter’s power trace / grounding the cap may be in order.
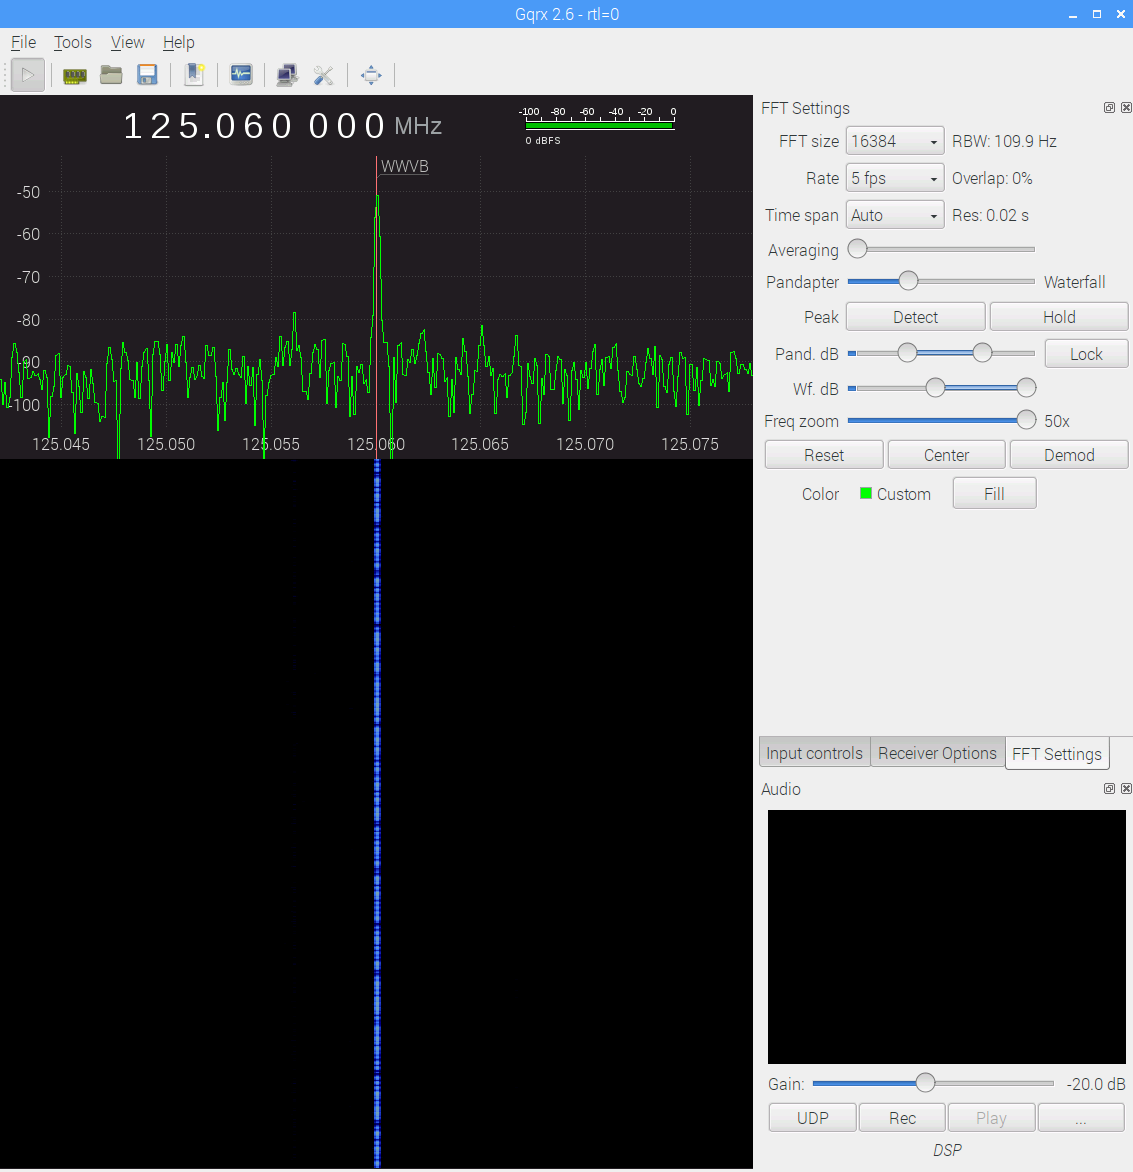
The SDR’s AGC contributes about 30 dB of gain, compresses the hottest signals at -25 dB, and raises those harmonics out of the grass, so it’s not an unalloyed benefit. Manually cranking on 10 dB seems better:
WWVB – xtal filter – waterfall – 10 dB hardware preamp – 2017-11-16 0630 EST
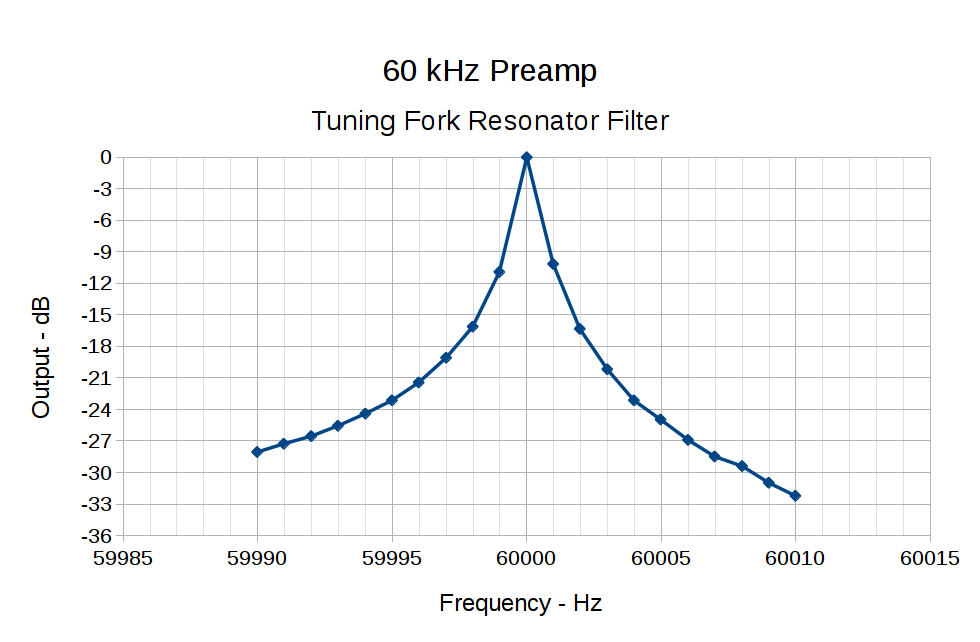
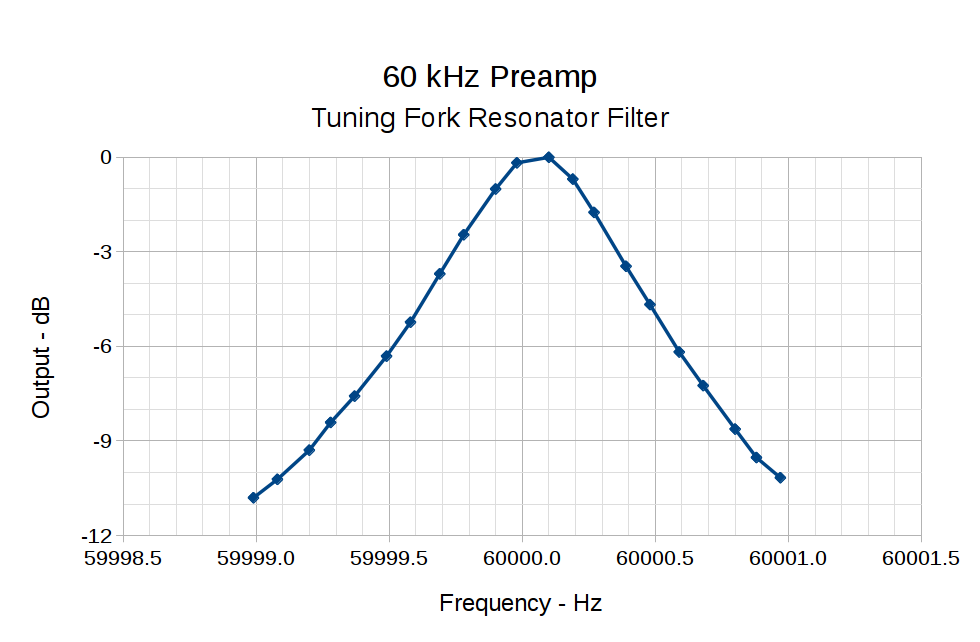
The bump in the middle shows the WWVB preamp’s 2 kHz bandwidth around the 60 kHz filter output, so the receiver isn’t horribly compressed. The carrier rises 30 dB over that lump, in reasonable agreement with the manual measurements over a much narrower bandwidth:
60 kHz Preamp – Bandwidth – 1 Hz steps
With all that in mind, a bit of careful tweaking produces a nice picture:
WWVB – xtal filter – waterfall – 10 dB hardware preamp – 2017-11-16 0713 EST
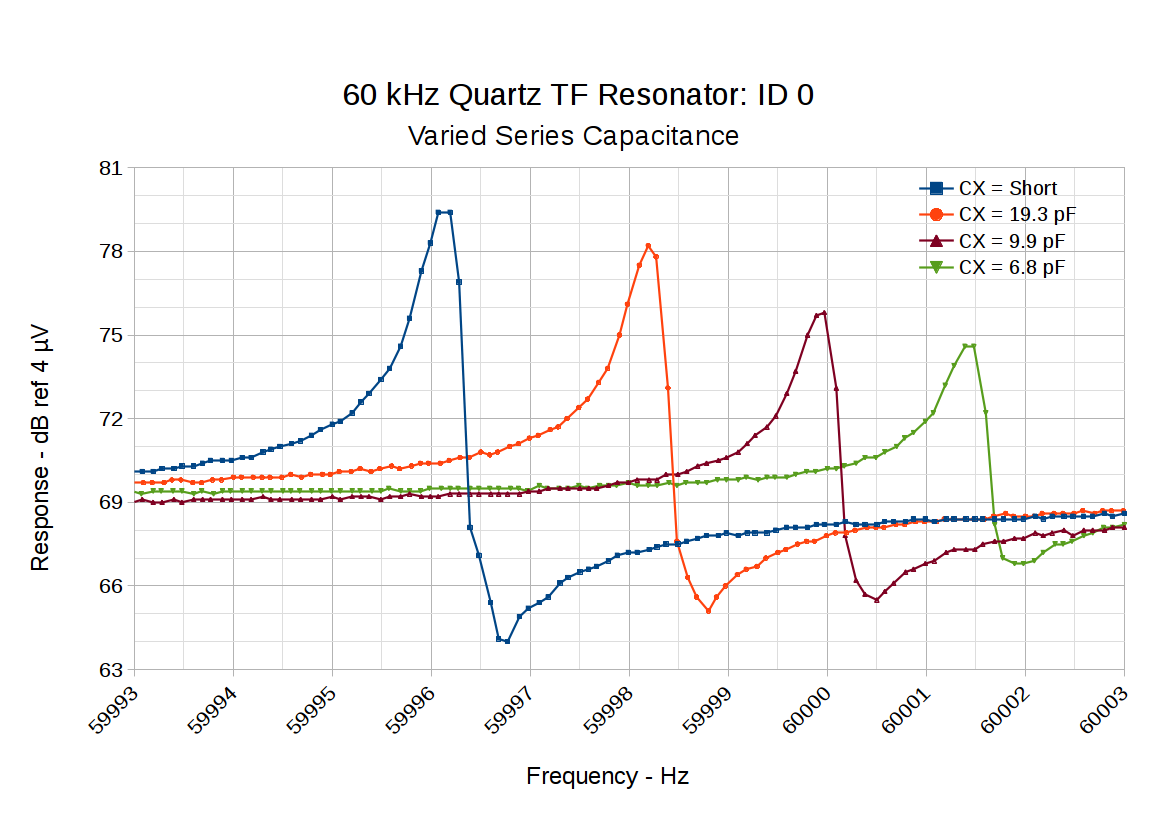
Putting a small capacitor in series with the tuning fork resonator pulls the series resonant frequency upward and reduces the amplitude:
60 kHz Quartz TF Resonator – CX variations
So something around 10 pF, net of stray capacitance and suchlike, should suffice. Plunk a small twiddlecap on the preamp board and tune for best picture:
While contemplating all the hocus-pocus and precision alignment involved in the DIY plotter project, it occurred to me you could conjure a plotter from a pair of steppers, two disks, a lifting mechanism, and not much else. The general idea resembles an Rθ plotter, with the paper glued to a turntable for the “theta” motion, but with the “radius” motion produced by pen(s) on another turntable:
Rotary Plotter – geometry 4
The big circle is the turntable with radius R1, which might be a touch over 4.5 inches to fit an 8.5 inch octagon cut from ordinary Letter paper. The arc with radius R2 over on the right shows the pen path from the turntable’s center to its perimeter, centered at (R1/2,-R1) for convenience.
The grid paper represents the overall Cartesian grid containing the XY points you’d like to plot, like, for example, point Pxy in the upper right corner. The object of the game is to figure out how to rotate the turntable and pen holder to put Pxy directly under the pen at Ixy over near the right side, after which one might make a dot by lowering the pen. Drawing a continuous figure requires making very small motions between closely spaced points, using something like Bresenham’s line algorithm to generate the incremental coordinates or, for parametric curves like the SuperFormula, choosing a small parameter step size.
The offset between the two centers is (ΔX,ΔY) and the distance is R2 = sqrt(ΔX² + ΔY²). The angle between the +X axis and the pen wheel is α = atan2(ΔY,ΔX), which will be negative for this layout.
Start by transforming Pxy to polar coordinates PRθ, which produces the circle containing both Pxy and Ixy. A pen positioned at radius R from the center of the turntable will trace that circle and Ixy sits at the intersection of that circle with the pen rotating around its wheel.
The small rectangle with sides a and b has R as its diagonal, which means a² + b² = R² and the pointy angle γ = atan a/b.
The large triangle below that has base (R2 – a), height b, and hypotenuse R2, so (R2 – a)² + b² = R2².
Some plug-and-chug action produces a quadratic equation that you can solve for a as shown, solve for b using the first equation, find γ from atan a/b, then subtract γ from θ to get β, the angle spearing point Ixy. You can convert Rβ back to the original grid coordinates with the usual x = R cos β and y = R sin β.
Rotate the turntable by (θ – β) to put Pxy on the arc of the pen at Ixy.
The angle δ lies between the center-to-center line and Ixy. Knowing all the sides of that triangle, find δ = arccos (R2 – a) / R2 and turn the pen wheel by δ to put the pen at Ixy.
Lower the pen to make a dot.
Done!
Some marginal thinking …
I’m sure there’s a fancy way to do this with, surely, matrices or quaternions, but I can handle trig.
You could drive the steppers with a Marlin / RAMPS controller mapping between angles and linear G-Code coordinates, perhaps by choosing suitable steps-per-unit values to make the degrees (or some convenient decimal multiple / fraction thereof)correspond directly to linear distances.
You could generate points from an equation in, say, Python on a Raspberry Pi, apply all the transformations, convert the angles to G-Code, and fire them at a Marlin controller over USB.
Applying 16:1 microstepping to a stock 200 step/rev motor gives 0.113°/step, so at a 5 inch radius each step covers 0.01 inch. However, not all microsteps are moved equally and I expect the absolute per-step accuracy would be somewhere between OK and marginal. Most likely, given the application, even marginal accuracy wouldn’t matter in the least.
The pen wheel uses only 60-ish degrees of the motor’s rotation, but you could mount four-ish pens around a complete wheel, apply suitable pen lift-and-lower action and get multicolor plots.
You could gear down the steppers to get more steps per turntable revolution and way more steps per pen arc, perhaps using cheap & readily available RepRap printer GT2 pulleys / belts / shafts / bearings from the usual eBay sellers. A 16 tooth motor pulley driving a 60 tooth turntable pulley would improve the resolution by a factor of 3.75: more microsteps per commanded motion should make the actual motion come out better.
Tucking the paper atop the turntable and under the pen wheel could be a challenge. Perhaps mounting the whole pen assembly on a tilting plate would help?
Make all the workings visible FTW!
Some doodles leading up to the top diagram, complete with Bad Ideas and goofs …
Centering the pen wheel at a corner makes R2 = R1 * sqrt(2), which seems attractive, but seems overly large in retrospect:
Rotary Plotter – geometry 1
Centering the pen wheel at (-R1,R1/2) with a radius of R1 obviously doesn’t work out, because the arc doesn’t reach the turntable pivot, so you can’t draw anything close to the center. At least I got to work out some step sizes.
A first attempt at coordinate transformation went nowhere:
Rotary Plotter – geometry 2
After perusing the geometric / triangle solution, this came closer:
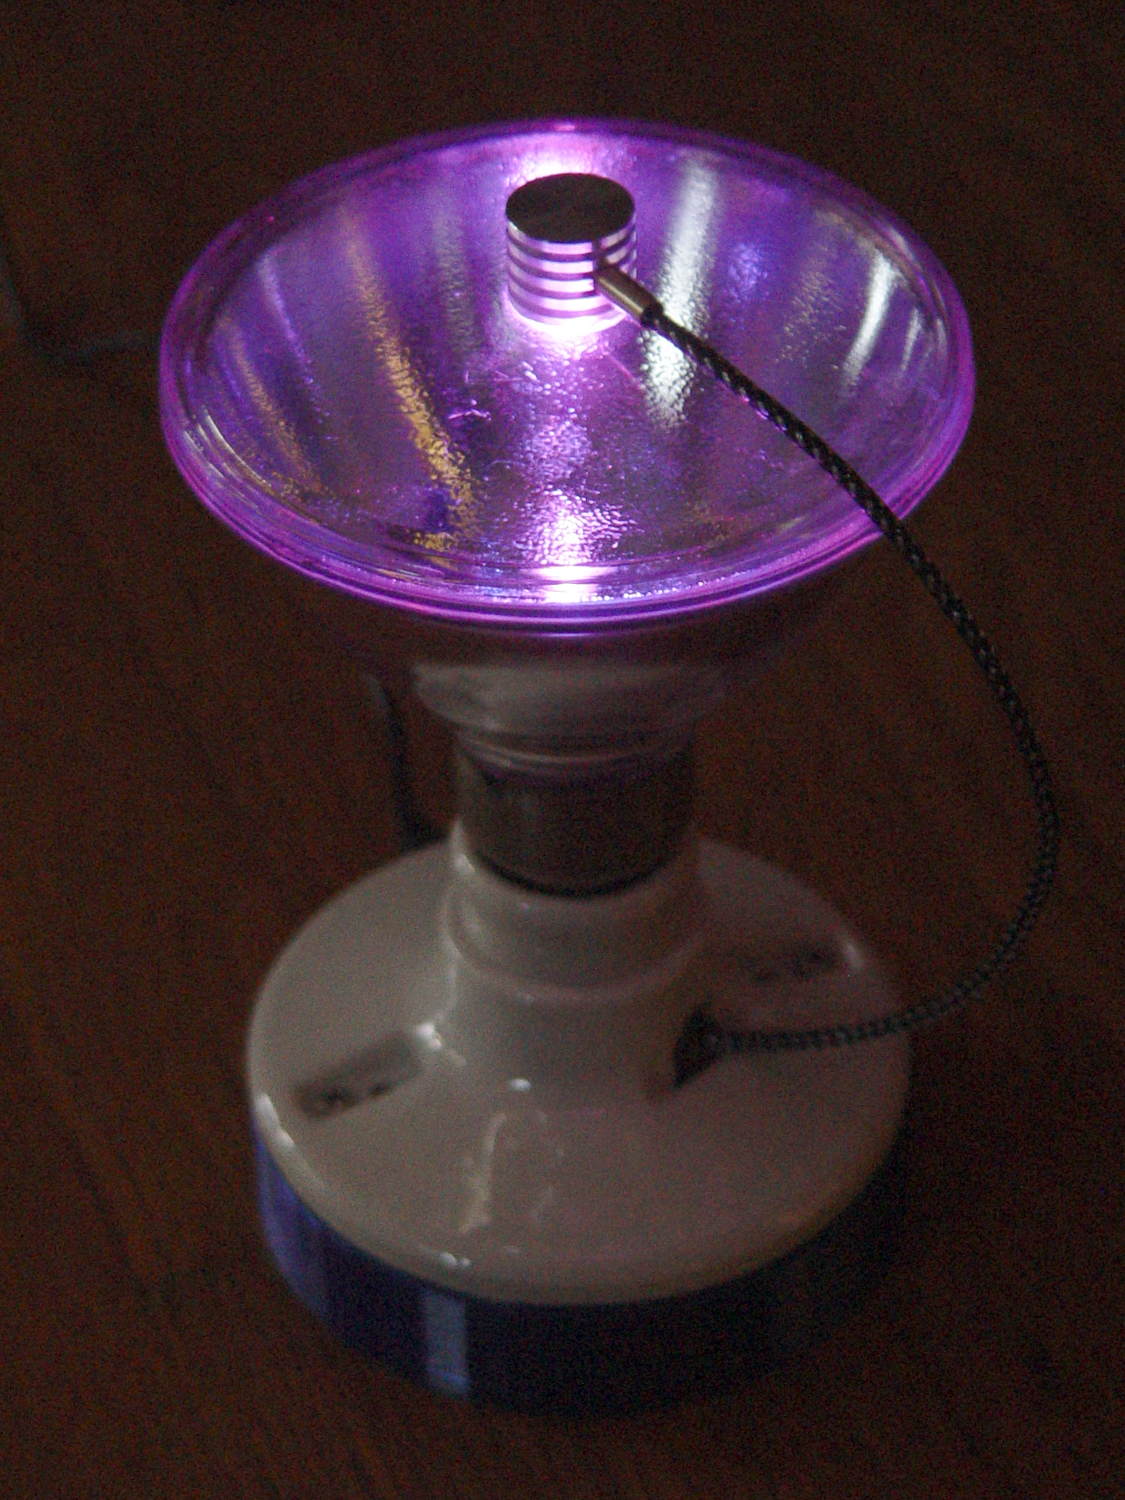
I’d done an unusually good job of epoxying the ersatz heatsink in place:
Reflector floodlight – finned LED holder
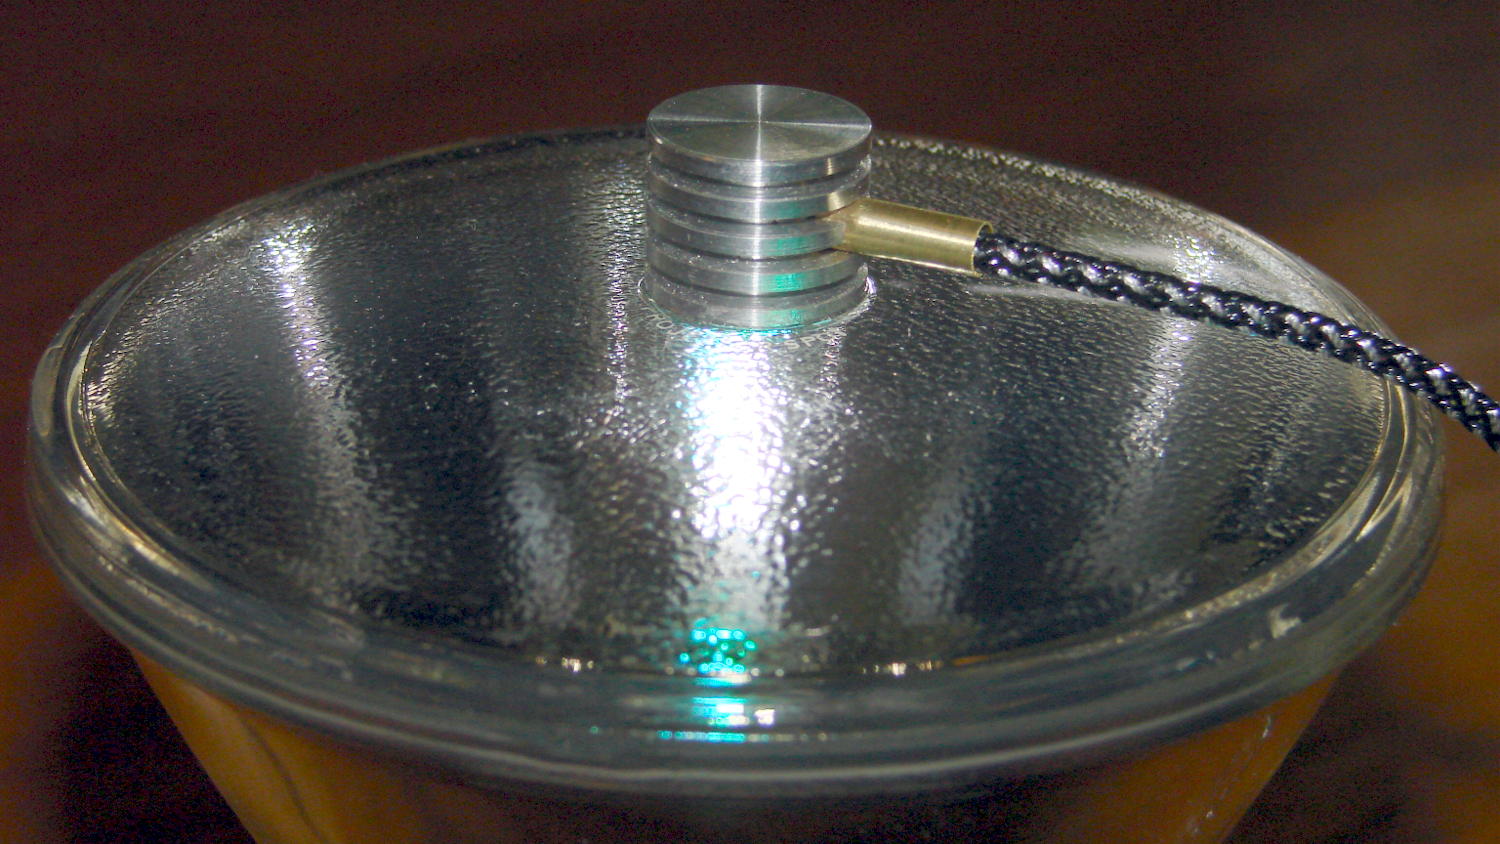
I wrapped the bulb in a towel with only the heatsink sticking out, whacked the side of the heatsinkparallel to the glass with a plastic-face hammer, and it popped right off:
Epoxy vs glass – divot
The missing piece of the epoxy ring turned out to be a divot ripped out of the glass, which I didn’t notice until I’d chipped the fragment off the aluminum, so no pictures.
Given the relative strengths of epoxy and glass, pulling a divot seems impossible, but folks doing 3D printing on glass platforms have been reporting exactly that failure for years. The prevailing theory seems to involve small scratches and defects in the glass surface, with subsequent weakening, and stresses applied to the epoxy perpendicular to the glass surface pulling the cracks apart.
Replacing the RGB LED will require drilling it out and probably a complete rewiring, because I seem to have made liberal use of epoxy inside the heatsink and brass tube.