In round numbers, a nasty COVID-19 infection ramps up for a week before you develop enough symptoms to finally get tested. Various states report various combinations of test results as confirmed / probable / tested “cases”, with “tested” including any possible combination (or lack thereof) of viral / antibody presence. As a result, the number of “daily cases” doesn’t mean much, but it’s the only number we’re likely to get. With that in mind, about 6% of those tested have a positive result for whatever they’re being tested for. Got that?
At some point within a week or two of being infected, tested, and found positive, about 2.8% of all cases will be hospitalized. That’s 2.4% of cases in the 18-49 age bracket and 4.3% of my decade (64-75):

You get the Weekly Rate chart from the CDC’s weekly data by drilling into the Hospitalization block to reach the summary chart (through Additional Rate Data), dinking with the controls to show the Weekly Rate and COVID-NET Surveillance Area, then turning off the overlapping age ranges. Most of us seem to have an Underlying Medical Condition or two affecting the outcome.
Roughly a week (more or less, kinda-sorta) after hospitalization, 15% of all patients and 28% of those over 65 will die:

You get that chart from the Lab-Confirmed Hospitalizations page by dinking around with the controls for the lower-right pane. The Overall column represent 5800 patients and, as it happens, each column represents about 2000 patients.
Because it takes about three weeks to go from “infected” to “dead”, the ratio of [daily deaths today] to [daily positive test results from three weeks earlier] gives (In My Opinion) a better indication of the expected outcome than the simpler ratio of [today’s deaths] to [today’s test positives]. Because the news headlines always feature cumulative numbers, these numbers aren’t at the tip of anyone’s awareness.
Fetch the daily data as a CSV from the COVID Tracking Project’s Historical Data, compute the day-to-day values from the appropriate columns, then slam the columns into a graph:

The strong weekly component is surely a combination of data aggregation (no weekend reports?) and actual death events (nobody dies on Sunday?), but there’s no way to know from here. There’s plenty of noise in April which I decided to completely ignore; consult the raw data and draw your own conclusion.
Eyeballometrically, the lagged CFR has been declining linearly by 1% every 3 weeks since mid-May and should be around 2% in July. If you’re under 50 and in reasonable health, the news is even better, because you’re very unlikely to either need hospitalization or die from it. Again, work the numbers out for yourself from the raw data.
However, AFAICT, those results depend on a relatively unloaded healthcare system, because little of the US has (yet) to experience the catastrophic overload seen during the early onset in Washington state and NYC. This chart of ICU occupancy suggests the worst is yet to come for folks in states where expectations don’t match up to the reality of exponential growth:

It seems having the ICUs tick along at 50% occupancy is about right, so the states with 70+% occupancy don’t have much surge margin.
Right now, COVID-19 is burning through the US population at about 30,000 confirmed new cases per day, which means 840 people will require hospitalization every day next week (in addition to all the usual hospitalizations for other causes) and, in another week, 126 people will die every day. Maybe 40 people under age 50 will die, so the human herd will develop immunity by killing off we Olde Fartes.
After I ran those numbers, the rate passed 40,000 cases per day, with no sign of slowing down and indications it’s getting worse faster. Scale my numbers up by 30%: 1100 hospitalizations and 170 deaths per day in a few weeks.
However, if you live in one of those dark purple states already showing 70+% ICU utilization, don’t do anything starting with “Hold my beer. Watch this!” because you will not get a welcoming Emergency Room reception. The CNN synoptic view of new cases continues to be informative.
One of Mary’s cronies is married to a guy who knows this whole COVID-19 thing is a hoax: “They’d all have died of something else, anyway.” Plotting all-cause fatalities vs. age (2020 in red, last five years in gray) shows tens of thousands of people are dying from something new this year:
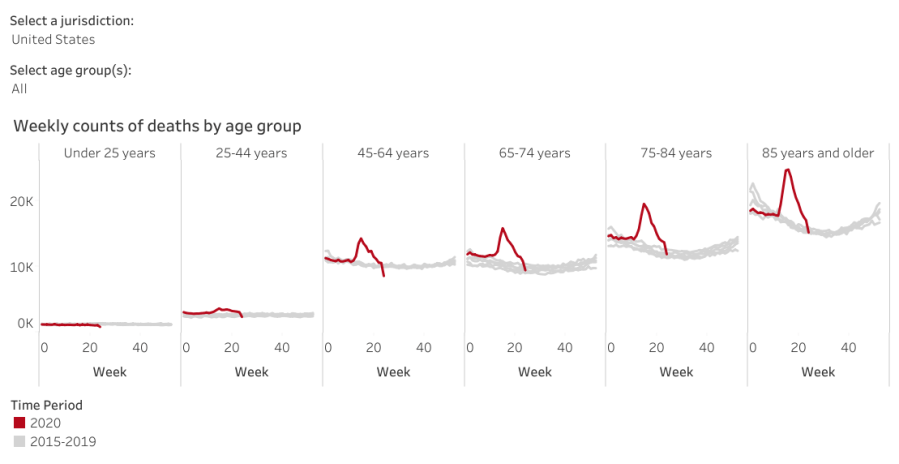
Before you do the happy dance about the downward slope toward the right, read the disclaimer:
Data are incomplete because of the lag in time between when the death occurred and when the death certificate is completed, submitted to NCHS and processed for reporting purposes. This delay can range from 1 week to 8 weeks or more, depending on the jurisdiction and cause of death.
Some of the decline is real, because NYC hospitals aren’t running out of body bags nowadays, but much of it seems due to the paperwork not catching up with reality.
Judging from the slope of the Johns Hopkins summary of daily cases in the US, corroborated by the CNN projections, the doubling time (before the most recent increases) runs around four weeks: five million cases by the end of July and ten million by the end of August. Later this year, we’ll know how well saying “It’ll be gone by April summer Election Day 2021″ without doing anything has worked out for us.
The overall death rate should decline in a few years, because those (of us?) who died early will reduce the later rate, but it’s not something to look forward to.
Back to the Basement Laboratory … and, on good days, the rail trail.

Comments
2 responses to “Monthly Science: COVID-19 Lagged CFR”
Now that’s what I call funny
Half of us have survived being twenty-something males, so it’s possible to outgrow the meme. [grin]