The picture says it all:
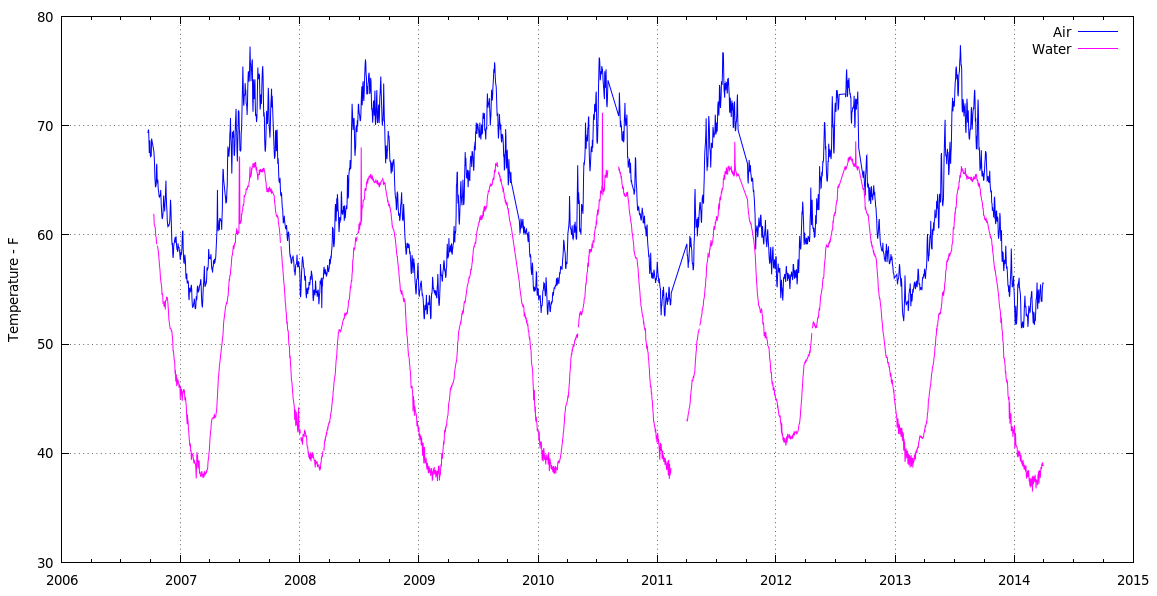
Much as we thought, this past winter was really cold.
The data consists of all 3/4 million data logger records concatenated into one huge CSV file, fed through a Sed pipe to normalize all the dates & suchlike, then passed into a Python script that produces one record for each day (all 2561 of ’em) containing the date, minimum air & water temperatures, and the minimum relative humidity.
This needs (a lot) more work to be pretty, but at least the pieces hang together.
The Python source code:
#!/usr/bin/python3
''' Extract minimum groundwater / air temperatures & humidity from CSV files
'''

import sys
import csv
import datetime
import string

# Columns in Hobo datalogger CSV file

SEQNUM = 0
DATETIME = 1
AIRTEMP = 2
RELHUM = 3
WATERTEMP = 4

datapoints = {}

with open('AllClean.csv',encoding='iso-8859-15') as dbi:
    for row in csv.reader(dbi):
        if (not row[SEQNUM].startswith("#")):            # discard comments
            logdt = datetime.datetime.strptime(row[DATETIME],'%m/%d/%Y %H:%M:%S')
            logdate = datetime.datetime.date(logdt)
            if (logdate in datapoints):             # accumulate minimum temps & RH
                datapoints[logdate][0] = min(datapoints[logdate][0],row[AIRTEMP])
                datapoints[logdate][1] = min(datapoints[logdate][1],row[RELHUM])
                datapoints[logdate][2] = min(datapoints[logdate][2],row[WATERTEMP])
            else:
                datapoints[logdate] = [row[AIRTEMP], row[RELHUM], row[WATERTEMP]]

with open('AllMinData.csv','w',newline='') as csvf:
    dbo = csv.writer(csvf)
    dbo.writerow(('#Date','Min Air T','Min RH','Min Water T'))
    for key,value in sorted(datapoints.items()):
        dbo.writerow([key,value[0],value[1],value[2]])
The encoding='iso-8859-15' for the input file turns out to be absolutely essential, as the Hoboware program generating the CSV files uses a 0xb0 character for the usual degree symbol. Alas, that chokes the default utf-8, ascii, and even cp437 codecs. Took a while to figure that out, it did, indeed.
There remain random anomalies in the data, in addition to the glitches produced by unplugging the remote temperature sensor cable. I may simply discard the last few records of each CSV file; right now, the Gnuplot code simply ignores temperatures under 30 °F and over 80 °F.
The Gnuplot script that produced the graph consisted of some hand-fed tweakery based on the guts of the routine that plotted the original records, with the output image bank-shotting off the clipboard into GIMP on its way to becoming a PNG file. Phew!

Comments
2 responses to “Monthly Science: Minimum Groundwater Temperatures, 2006-2014”
just wondering why you use GIMP to produce a .png file – you can do that in gnuplot :)
That’s what the usual script does for a living, but in this case I just fired a screenshot into GIMP, cropped off everything that wasn’t the graph, and saved the result into a PNG file.
Truth: I was too busy doing the happy dance to create a real script from the hand-cranked mess that produced that graph. Gotta have something for next month, right? [grin]