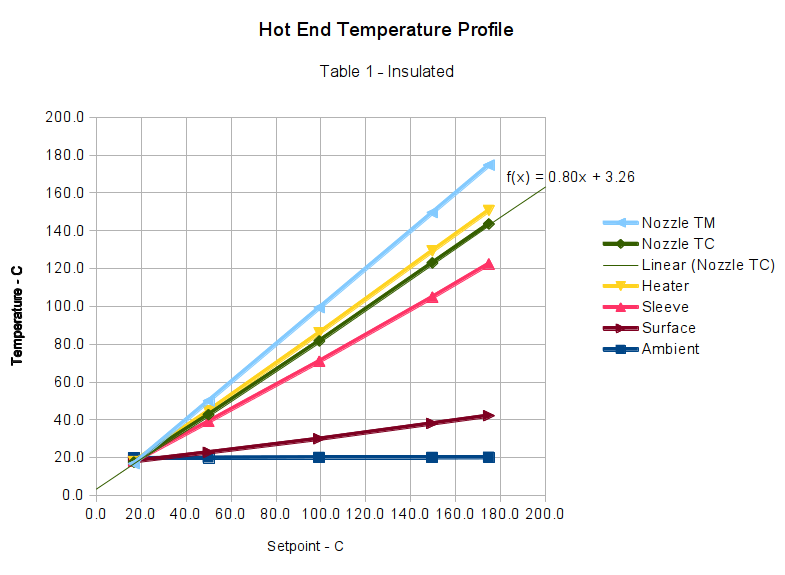
Those measurements suggested that my initial correction to the Table 1 values weren’t quite correct, but a similar correction might work as long as I didn’t change the insulating wrap. This graph includes a linear fit to the Nozzle TC data, based on the original M2 firmware’s Table 1 thermistor data and cotton insulation:
Applying that equation to Table 1 produces this thermistor lookup table:
#if (THERMISTORHEATER_0 == 8) || (THERMISTORHEATER_1 == 8) || (THERMISTORHEATER_2 == 8) || (THERMISTORBED == 8) // M2 thermistors on RAMBO
const short temptable_8[][2] PROGMEM = {
	{23*OVERSAMPLENR, 243},
	{25*OVERSAMPLENR, 239},
	{27*OVERSAMPLENR, 235},
	{28*OVERSAMPLENR, 231},
	{31*OVERSAMPLENR, 227},
	{33*OVERSAMPLENR, 223},
	{35*OVERSAMPLENR, 219},
	{38*OVERSAMPLENR, 215},
	{41*OVERSAMPLENR, 211},
	{44*OVERSAMPLENR, 207},
	{48*OVERSAMPLENR, 203},
	{52*OVERSAMPLENR, 199},
	{56*OVERSAMPLENR, 195},
	{61*OVERSAMPLENR, 191},
	{66*OVERSAMPLENR, 187},
	{71*OVERSAMPLENR, 183},
	{78*OVERSAMPLENR, 179},
	{84*OVERSAMPLENR, 175},
	{92*OVERSAMPLENR, 171},
	{100*OVERSAMPLENR, 167},
	{109*OVERSAMPLENR, 163},
	{120*OVERSAMPLENR, 159},
	{131*OVERSAMPLENR, 155},
	{143*OVERSAMPLENR, 151},
	{156*OVERSAMPLENR, 147},
	{171*OVERSAMPLENR, 143},
	{187*OVERSAMPLENR, 139},
	{205*OVERSAMPLENR, 135},
	{224*OVERSAMPLENR, 131},
	{245*OVERSAMPLENR, 127},
	{268*OVERSAMPLENR, 123},
	{293*OVERSAMPLENR, 119},
	{320*OVERSAMPLENR, 115},
	{348*OVERSAMPLENR, 111},
	{379*OVERSAMPLENR, 107},
	{411*OVERSAMPLENR, 103},
	{445*OVERSAMPLENR, 99},
	{480*OVERSAMPLENR, 95},
	{516*OVERSAMPLENR, 91},
	{553*OVERSAMPLENR, 87},
	{591*OVERSAMPLENR, 83},
	{628*OVERSAMPLENR, 79},
	{665*OVERSAMPLENR, 75},
	{702*OVERSAMPLENR, 71},
	{737*OVERSAMPLENR, 67},
	{770*OVERSAMPLENR, 63},
	{801*OVERSAMPLENR, 59},
	{830*OVERSAMPLENR, 55},
	{857*OVERSAMPLENR, 51},
	{881*OVERSAMPLENR, 47},
	{903*OVERSAMPLENR, 43},
	{922*OVERSAMPLENR, 39},
	{939*OVERSAMPLENR, 35},
	{954*OVERSAMPLENR, 31},
	{966*OVERSAMPLENR, 27},
	{977*OVERSAMPLENR, 23},
	{985*OVERSAMPLENR, 19},
	{993*OVERSAMPLENR, 15},
	{999*OVERSAMPLENR, 11},
	{1004*OVERSAMPLENR, 7},
	{1008*OVERSAMPLENR, 3},
	{1011*OVERSAMPLENR, 0}
};
#endif
I extrapolated the last entry from the previous two, because if the table doesn’t include an entry for 0 °C, then when you turn the heater off, the setpoint winds up being the lowest temperature greater than zero. Doesn’t make any difference, I think, but looks odd.
Load that table, run the temperature up, record more data:

The error isn’t particularly pretty, being off by +4 °C at the high end. You could hand-tweak the linear fit equation to push the error down at normal operating temperatures, but it’s close enough for my purposes.
Although I don’t have any numbers, one benefit of tighter thermal coupling to the extruder nozzle is greatly reduced overshoot during heating.
