Ed Nisley's Blog: Shop notes, electronics, firmware, machinery, 3D printing, laser cuttery, and curiosities. Contents: 100% human thinking, 0% AI slop.
Category: Science
If you measure something often enough, it becomes science
The next morning the dead section lit up again, albeit with a dim ring at its right end. I think one LED in that string failed open and darkened the whole string, then failed short under the voltage stress, and is now quietly simmering in there with slightly higher than usual current.
The lights over the workbench weren’t in the first wave of conversions, so they may be only four years old.
For sure, they have yet to approach their 50000 hour lifetime …
This was really a thinly veiled excuse for a deeper look at the QR code generator encoding the myriad parameters required to create the box and see what happens when you try to burn such a complex thing into chipboard.
Spoiler: chipboard has very low contrast and really does not work well with high-density QR codes.
Although the festi.info box generator can produce QR codes, I used qrencode (available in your Linux distro) on the command line to generate QR code image files with specific settings:
--size → size of the smallest square (“module”) in pixels
--dpi → DPI of the output image file
The default file type is PNG. The unusual 254 DPI makes each pixel exactly 0.1 mm wide and a peculiar 169.33 DPI = 0.15 mm came in handy for the first pattern.
The final parameter is the character string to encode, which you should definitely quote to prevent the shell from wrecking things while trying to help you.
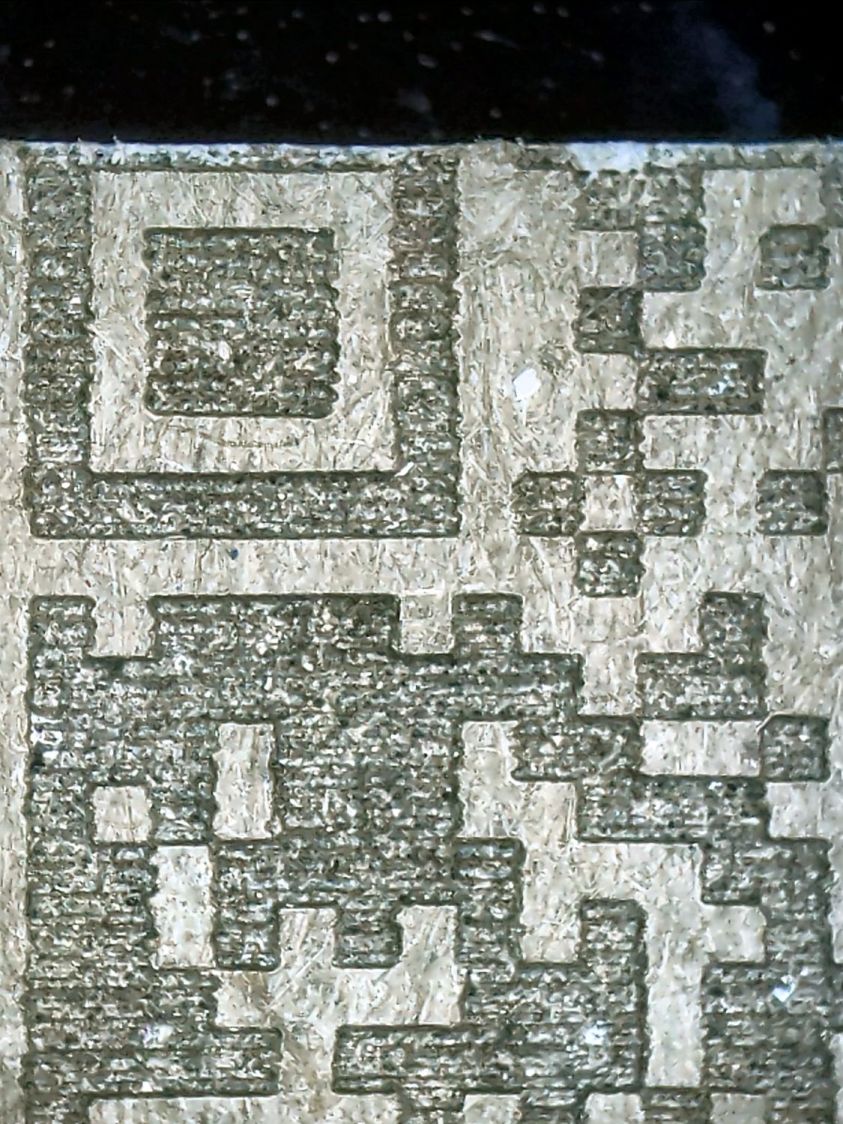
A pattern with 4×4 pixel modules didn’t scan at all:
Chipboard QR code – 15pct 0.15mm 4×4 – overview
A closer look shows the modules have ragged edges due to laser timing variations during the engraving scans and gaps between successive scans because the spot size is less than the 0.15 mm scan interval:
Chipboard QR code – 15pct 0.15mm 4×4 – detail
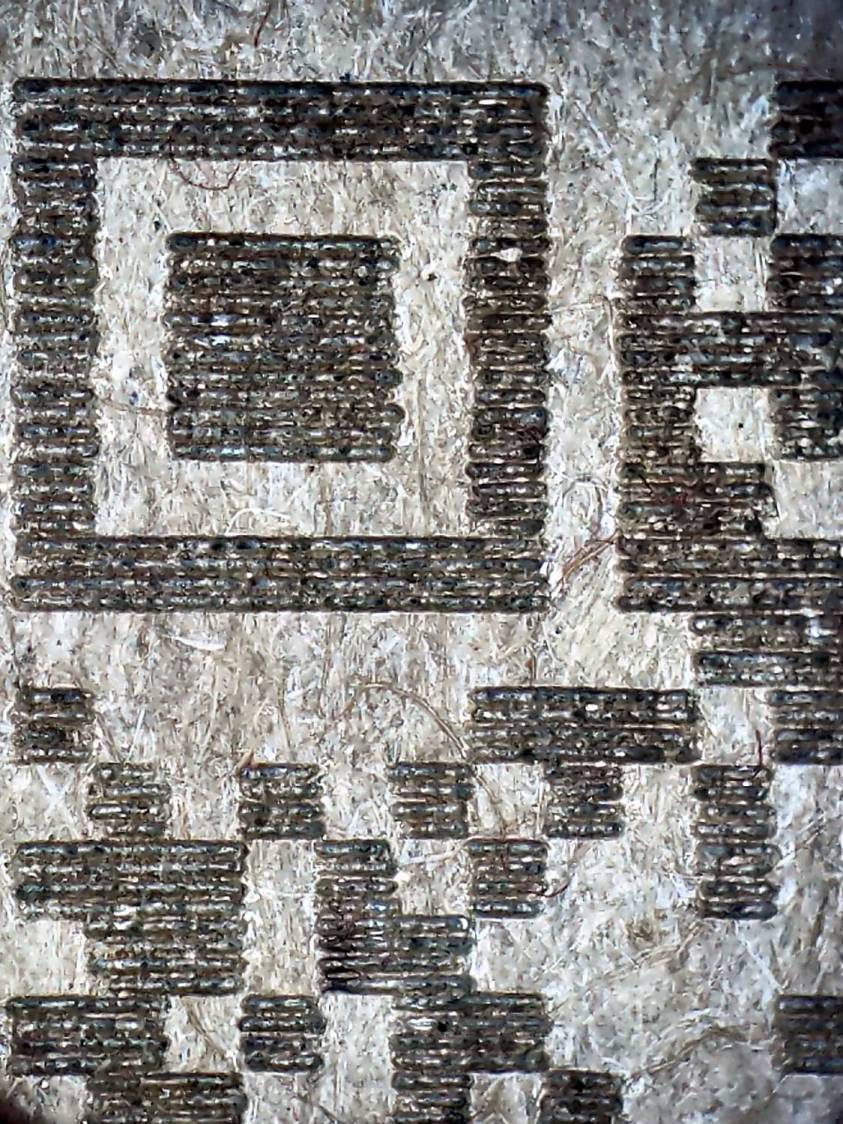
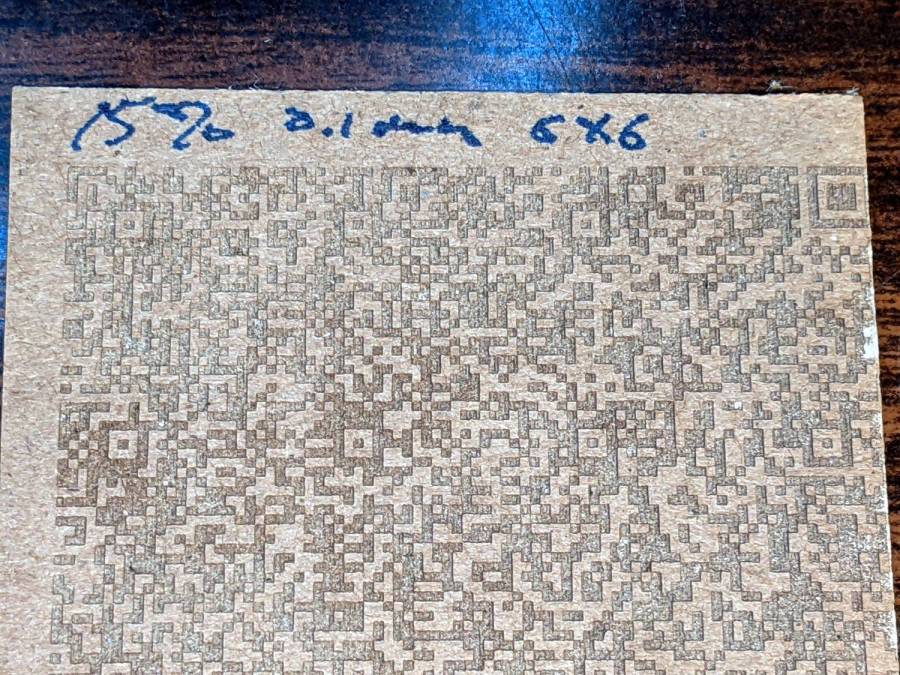
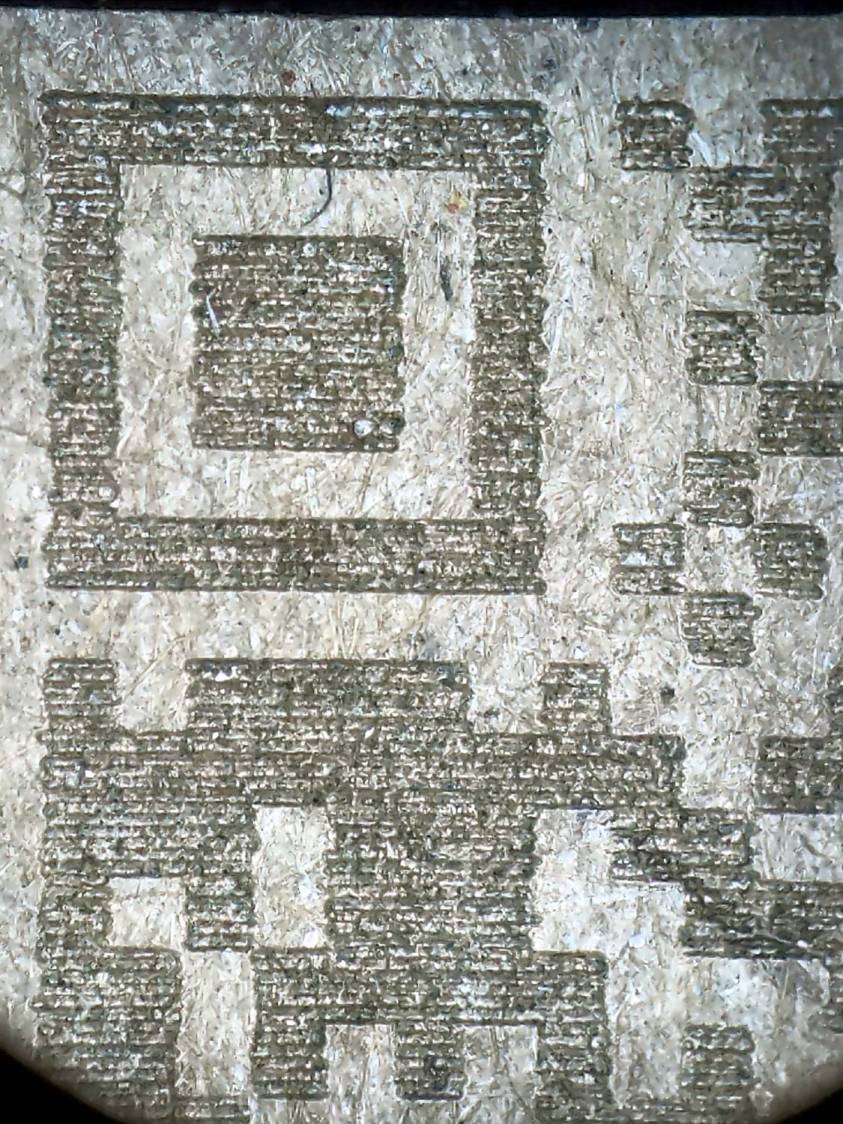
Increasing the module to 6×6 pixels at a 0.1 mm scan interval :
Chipboard QR code – 15pct 0.10mm 6×6 – overview
A closer look shows the larger module reduces the relative size of the timing errors, while the decreased line spacing tidies up the blocks:
Chipboard QR code – 15pct 0.10mm 6×6 – detail
Reducing the power from 15% to 10% reduced the contrast to the point of illegibility:
Chipboard QR code – 10pct 0.10mm 6×6 – overview
A closer look shows the engraving barely punches through the surface and has somewhat more ragged edges due to the tube’s pulsating startup current at very low power:
Chipboard QR code – 10pct 0.10mm 6×6 – detail
I also tried 5×5 modules with similar results.
The laser spot size sets the engraving scan interval, which then determines the DPI value for the QR code image. With all that matched up, you can send the images directly to the laser in Passthrough mode, without having LightBurn resample the pixels and change the module’s shape.
Looked at from a different angle: given the laser spot size and the module size, the QR code image size is not under your control.
From another angle: given a QR code image size in, say, millimeters, and the engraving scan interval, the module size is not under your control.
All this is moot if you print QR codes on a high-resolution / high-contrast printer. It’s just the gritty nature of laser cuttery that limits what you can accomplish.
And, of course, using a material less awful than chipboard will definitely improve the results.
If you want a similar box of your own, here ya go:
The big price displays at the Mobil station on the corner have always behaved oddly, but these replacements began failing within a week of their installation:
Mobil price sign – north face
That doesn’t look too bad, until you notice the number of dead LEDs in both red displays.
The south face is in worse shape:
Mobil price sign – south face
The green LEDs seem to be failing less rapidly than the reds, but I don’t hold out much hope for them.
The previous display had seven-segment digits made of smooth bars, rather than discrete LEDs. This one appeared after the segments failed at what must have been more than full brightness; the red LEDs were distracting by day and blinding by night.
Maybe they got the LEDs from the same folks selling traffic signals to NYS DOT? The signals around here continue to fail the same way, so I suppose DOT doesn’t replace them until somebody enough people complain.
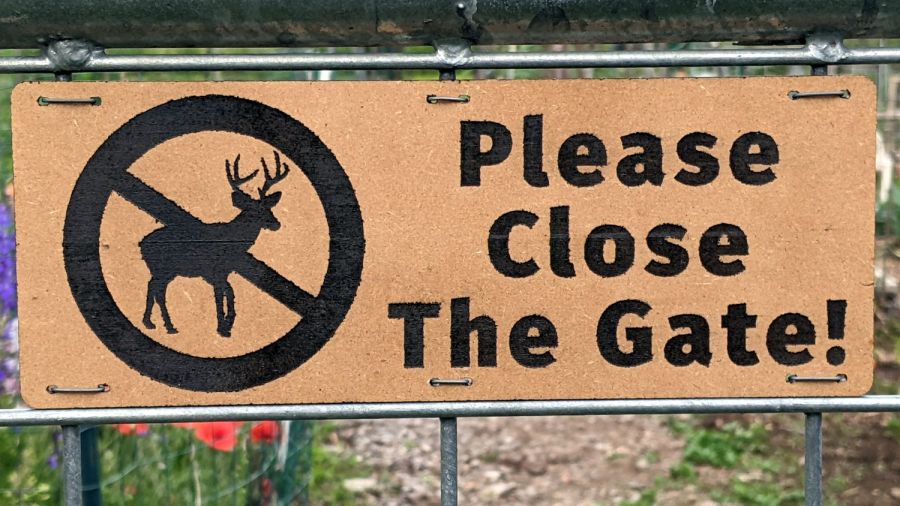
That’s eight months of weathering on MDF covered with indoor urethane sealant and it’s not as awful as I expected: the MDF didn’t actually disintegrate, it just collected some mold / mildew / crud.
A closer look:
Please Close The Gate – weathered MDF – detail
The black paint survived surprisingly well.
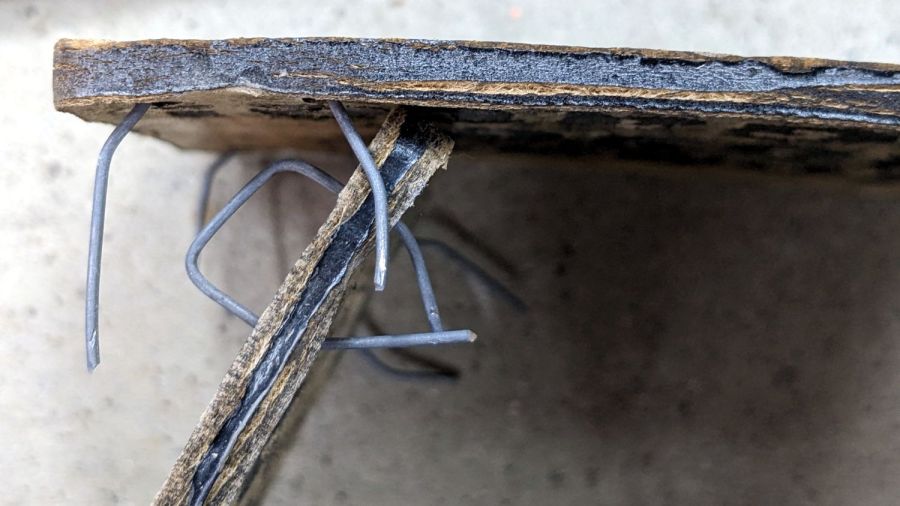
I hadn’t paid much any attention to the edges, so they got covered with random amounts of black paint and urethane. It seems that’s where the disintegration starts:
Please Close The Gate – weathered MDF – side view
MDF definitely isn’t the right material for an outdoor sign and I knew that going in, but it’s cheap and readily available, which makes up for a lot.
For comparison, they looked nice right after installation:
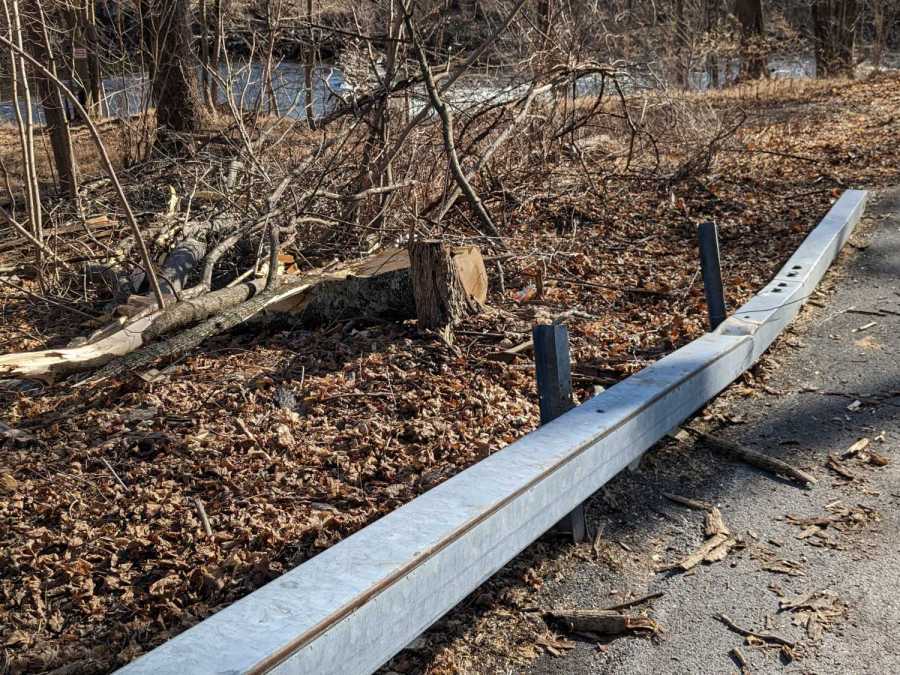
Spotted on a walk along the Mighty Wappingers Creek after a storm with plenty of gusty winds:
Tree-smashed guide rail
The tangle of branches and logs came from a tree that fell across the road from the far right side and put that crease into the guide rail. The vertical stump seems unrelated to that incident.
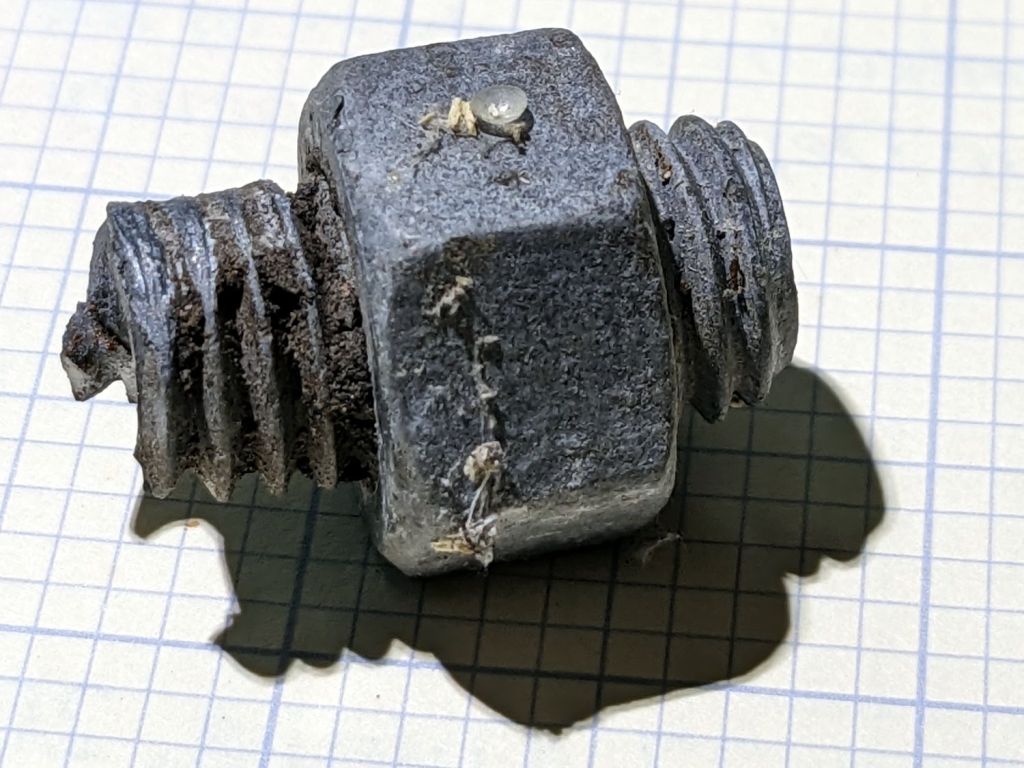
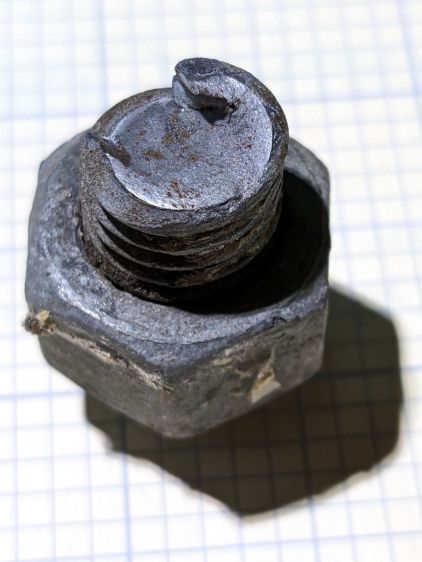
A bit of rummaging at the base of one post produced a victim:
Tree-smashed guide rail – sheared bolt – side
The impact produced enough force to turn the rail brackets into guillotine metal shears against the posts:
Tree-smashed guide rail – sheared bolt – end
It’s not a clean shear cut, which isn’t surprising under the circumstances.
The improved Holly Mirror Coaster looks pretty good:
Holly Coaster – overview
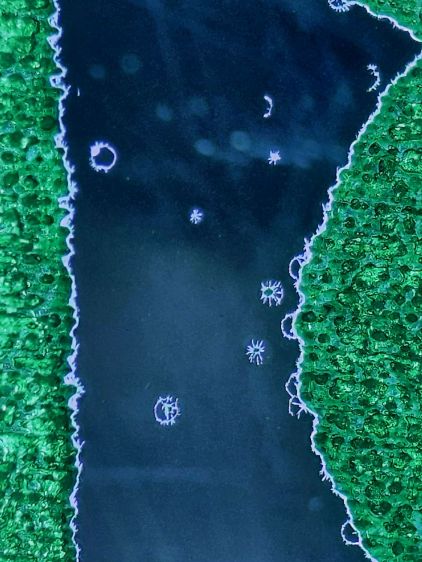
Until you realize some of those specks aren’t surface dust and take a closer look:
Holly Coaster – mirror speckles 1
The surface scratches are doubled by their reflection in the bottom mirror. The little dots that aren’t doubled reveal marks in the mirror surface itself.
In this case, they cause defects in the mirror coating allowing alcohol from the fat-tip permanent markers coloring the engraved areas to hit the acrylic. The starbursts come from stress cracks around the punctures.
Peering even closer shows similar cracks along the edges of the colored areas:
Holly Coaster – mirror speckles tight detail
Not much to do about the random speckles, but it’s obvious I must up my coloring game.
Which would be significantly easier if rattlecan spray paint sprayed at winter temperatures …
It’s now oriented with the back side of the lens toward the unfocused beam going into the laser head.
The front surface remains undamaged after two pulses at 500 ms 50% power:
Laser vs sunglasses – beam rear – front overview
The red disk in the middle of both wounds is new this time.
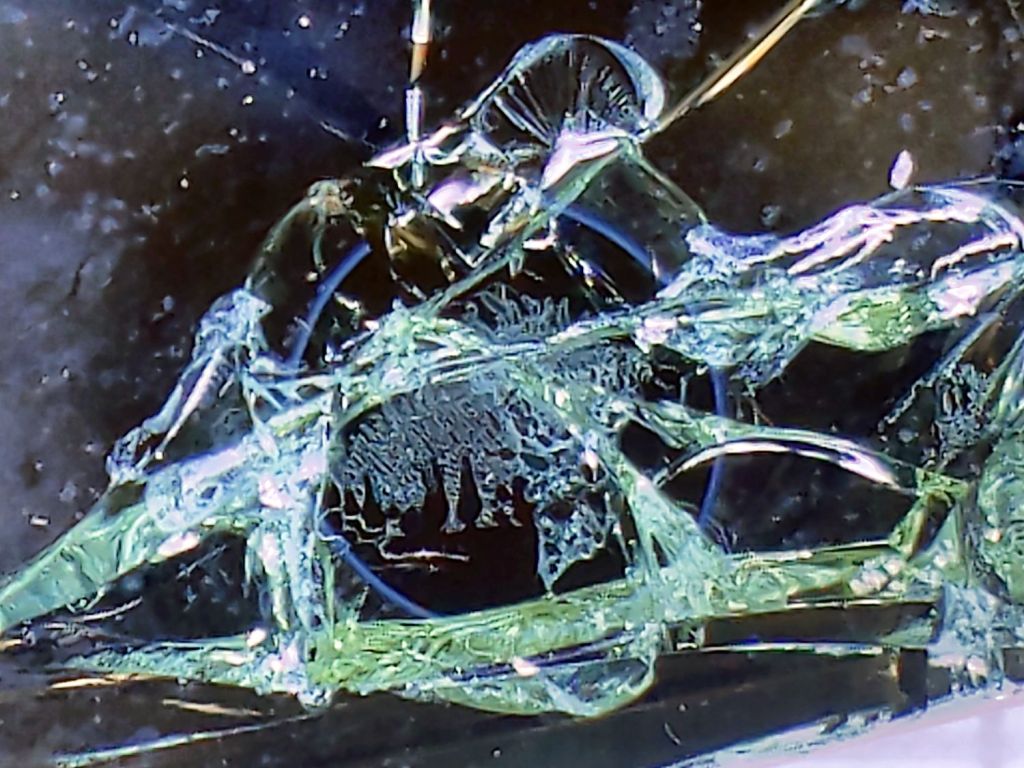
As seen from the rear, the first pulse shattered the rear glass layer:
Laser vs sunglasses – beam rear – A
The image is about 7 mm from side to side.
A chip of glass popped out of the upper part of the fracture, but the other pieces remained in place.
The distinct blue ring is 3 mm OD and marks the inner boundary of a purple disk surrounding the central burn. The disk appears only in reflected light (which is impossible to photograph with any setup I can manage), suggesting it comes from diffraction in a surprisingly uniform air layer blown between the glass and the plastic polarizing sheet.
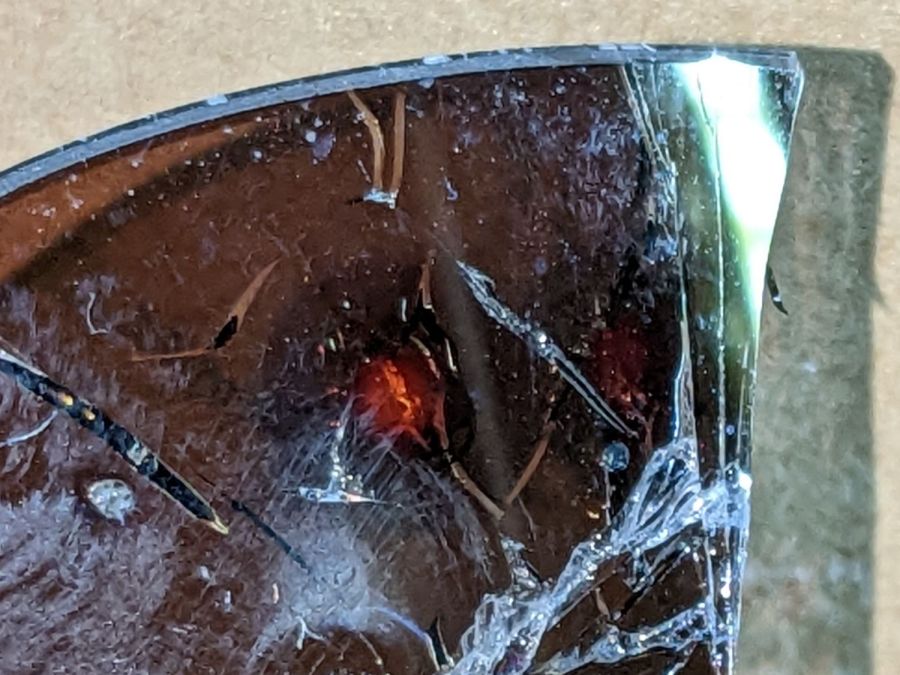
Also seen from the rear, the second pulse produced a neater wound:
Laser vs sunglasses – beam rear – B
The blue ring is again 3 mm OD and the image is 7 mm across.
The central red spot probably comes from damage to the polarizing sheet.
The most surprising things, at least to me, didn’t happen:
the glass lens didn’t disintegrate
the laser beam didn’t punch completely through
Protip: Don’t depend on ordinary glasses, even fancy sunglasses, to protect your eyes from CO₂ laser beams.