Ed Nisley's Blog: Shop notes, electronics, firmware, machinery, 3D printing, laser cuttery, and curiosities. Contents: 100% human thinking, 0% AI slop.
Based on that circuit simulation, the LED Stress Tester schematic looks about like you’d expect:
LED Stress Tester Schematic – updated
[Update: Left out the Schottky diode that makes the 20% duty cycle actually work. Drat & similar remarks.]
The manual wiring turned into a hairball, but from the top it looks pretty good:
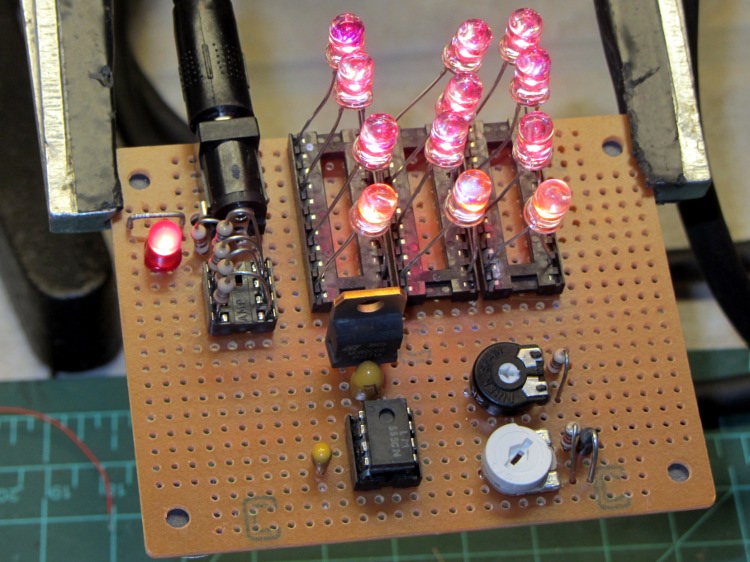
LED Stress Tester – red and amber LEDs
The 20 pin DIP IC sockets provide spare contacts, so that ruining a few by jamming fat LED leads into them won’t be a tragedy. Each LED string uses one of three adjacent contacts, which left room for a fourth string of amber LEDs that are, even to the naked eyeball, nearly indistinguishable from the red LEDs.
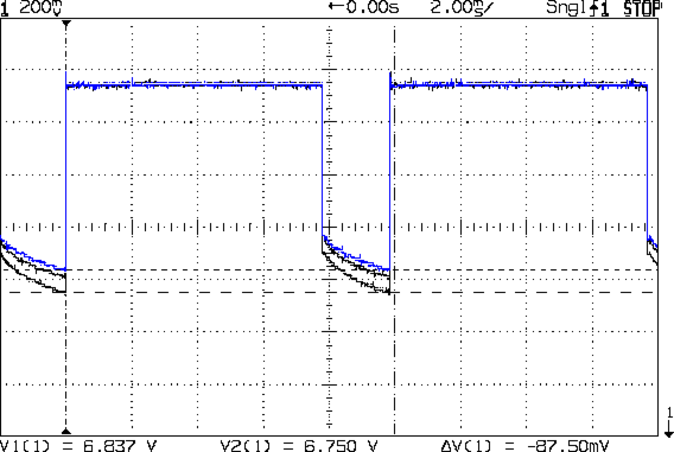
The 555 timer output waveform looks just like the simulation:
Timer Waveform
The trimpots sit near the middle of their rotations, which is always comforting. The duty cycle trimpot can’t quite get down to 1 ms, which doesn’t matter right now.
This scope shot shows the total forward drop across the three LED strings, with V=0 offset way down below the bottom of the display:
Red LED – group Vf
That voltage includes the IRLZ14 MOSFET drain-source voltage, which amounts to a bit less than the thickness of the fuzz on the traces. In round numbers:
VDS = 400 mA x 0.100 mΩ = 40 mV
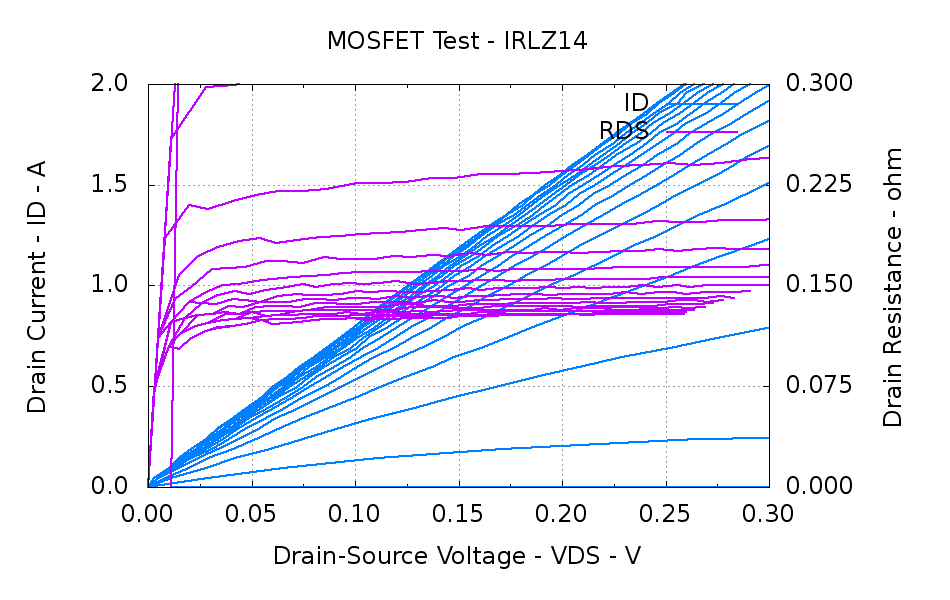
That’s based on this measurement from the MOSFET tester a while back:
IRLZ14 detail
You could argue the drain voltage is closer to 60 mV. I’d argue that the overall accuracy of all these measurements leaves a lot to be desired; we’re in the right ballpark no matter what.
Anyhow.
From the top, the three traces show LED groups 7-9, 1-3, and 4-6 in exactly the predicted order (1-3: 6.445, 4-6: 6.372, and 7-9:6.469 V), if not with exactly the predicted absolute voltages.
Part of the reason may be that the current limiting resistors that produced about 100 mA were 5.6 Ω, rather than the predicted 10 Ω, They actually measure about 5.7 Ω and the forward drop (from that scope shot) is around 750 mV, so the current could be up around 130 mA: a bit hot. I want to measure the current more closely before leaping to any conclusions.
The 1/4 W ballast resistors dissipate 100 mW peak / 20 mW average and each LED dissipates 300 mW peak and 60 mW average.
The 7.5 V wall wart I planned to use requires a much higher average load for good regulation (it emits 10.5 V for light loads), so this lashup runs from that 2 A bench supply through the other end of the Tek banana cable I hacked apart to make those SMD tweezers. The supply voltage at the coaxial jack drops by about 120 mV during the pulse, but we’re dealing with measurements up from ground.
I think the exponential curve in that scope shot shows the LED internal temperature rise during the pulse. If you figure -2 mV/°C (based on the ever-reliable and always accurate Wikipedia), then the 150 mV change along the exponential works out to 50 mV per LED and a 25 °C temperature rise. I have no idea whether thermal-cycling the LEDs at 100 Hz will cause early bond wire failure or not, which is why I want to let this run for a month or so.
While wiring up the LED stress tester, I realized I should abuse a string of amber LEDs along with the three red strings. Herewith, four amber LEDs from the top of their bag, with LED 5 = LED 1 retested:
Amber LEDs – 100 mA
Apart from being an outlier, that red trace seems much prettier than the others, doesn’t it?
The Bash / Gnuplot routine that produced the graph has a few tweaks:
#!/bin/sh
numLEDs=4
#-- overhead
export GDFONTPATH="/usr/share/fonts/truetype/"
base="${1%.*}"
echo Base name: ${base}
ofile=${base}.png
echo Input file: $1
echo Output file: ${ofile}
#-- do it
gnuplot << EOF
#set term x11
set term png font "arialbd.ttf" 18 size 950,600
set output "${ofile}"
set title "${base}"
set key noautotitles
unset mouse
set bmargin 4
set grid xtics ytics
set xlabel "Forward Voltage - V"
set format x "%6.3f"
set xrange [1.8:2.2]
#set xtics 0,5
set mxtics 2
#set logscale y
#set ytics nomirror autofreq
set ylabel "Current - mA"
set format y "%4.0f"
set yrange [0:120]
set mytics 2
#set y2label "right side variable"
#set y2tics nomirror autofreq 2
#set format y2 "%3.0f"
#set y2range [0:200]
#set y2tics 32
#set rmargin 9
set datafile separator "\t"
set label 1 "LED 1 = LED $((numLEDs + 1))" at 2.100,110 right font "arialbd,18"
set arrow from 2.100,110 to 2.105,103 lt 1 lw 2 lc 0
plot	\
    "$1" index 0:$((numLEDs - 1)) using (\$5/1000):(\$2/1000):(column(-2)) with linespoints lw 2 lc variable,\
    "$1" index $numLEDs using (\$5/1000):(\$2/1000) with linespoints lw 2 lc 0
EOF
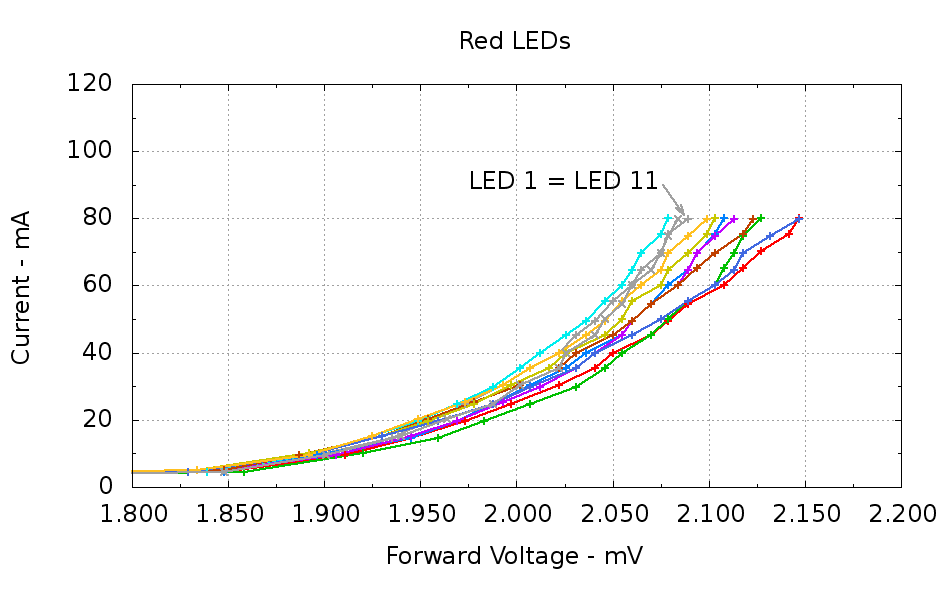
Running ten random red LEDs (taken from the bag of 100 sent halfway around the planet) through the LED Curver Tracer produces this plot:
Red LEDs – 80 mA
The two gray traces both come from LED 1 to verify that the process produces the same answer for the same LED. It does, pretty much.
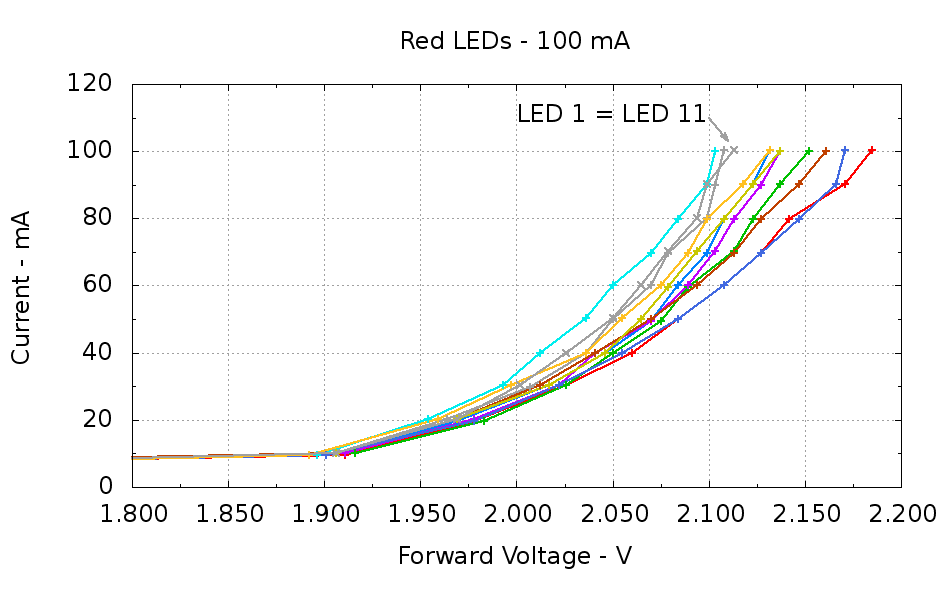
Repeating that with the same LEDs in the same order, but stepping 10 mA up to 100 mA produces a similar plot:
Red LEDs – 100 mA
The voltage quantization comes from the Arduino’s 5 mV ADC resolution (the readings are averaged, but there’s actually not much noise) and the current quantization comes from the step value in the measurement loop (5 mA in the first plot, 10 mA in the second). Seeing the LEDs line up mostly the same way at 80 mA in both graphs is comforting, as it suggests the measurement results aren’t completely random numbers.
Putting three red LEDs in series could produce a total forward drop anywhere between 6.309 V (3*2.103) and 6.555 V (3*2.185), a difference of nigh onto a quarter volt, if you assume this group spans the entire range of voltages and the whole collection has many duplicate values and you’re remarkably unlucky while picking LEDs. For this particular set, however, summing three successive groups of three produces 6.445, 6.372, and 6.469 V, for a spread of just under 100 mV. That suggests it’s probably not worthwhile to select LEDs for forward voltage within each series group of three, although matching parallel LEDs makes a lot of sense. I have no confidence the values will remain stable over power-on hours / thermal cycling / current stress.
The capacity plot for the Wouxun KG-UV3D lithium battery packs shows that there’s not a lot of capacity left after 7.0 V, so shutting down or scaling back to lower current wouldn’t be a major loss. However, it’s not clear a fixed resistor will do a sufficient job of current limiting with 6.5 V forward voltage across the LED string:
At 7.5 V, 100 mA calls for 10 Ω (drop 1 V at 100 mA)
At 8.2 V, 10 Ω produces 170 mA (1.7 V across 10 Ω)
At 7.0 V, 10 Ω produces 50 mA (0.5 V across 10 Ω)
Obviously, 170 mA is way too much, even by my lax standards.
A 100 mV variation in forward voltage between stacks, each with a 10 Ω resistor, translates into about 10 mA difference in current. This may actually call for current sensors and direct current control, although using a sensor per string, seems excessive. Low dropout regulators in current-source mode might suffice, but that still seems messy.
The test rig will run from a hard 7.5 V supply, which means I can use fixed resistors and be done with it.
The raw data behind those graphs, with LED 1 and LED 11 being the same LED:
#!/bin/sh
#-- overhead
export GDFONTPATH="/usr/share/fonts/truetype/"
base="${1%.*}"
echo Base name: ${base}
ofile=${base}.png
echo Input file: $1
echo Output file: ${ofile}
#-- do it
gnuplot << EOF
#set term x11
set term png font "arialbd.ttf" 18 size 950,600
set output "${ofile}"
set title "${base}"
set key noautotitles
unset mouse
set bmargin 4
set grid xtics ytics
set xlabel "Forward Voltage - V"
set format x "%6.3f"
set xrange [1.8:2.2]
#set xtics 0,5
set mxtics 2
#set logscale y
#set ytics nomirror autofreq
set ylabel "Current - mA"
set format y "%4.0f"
set yrange [0:120]
set mytics 2
#set y2label "right side variable"
#set y2tics nomirror autofreq 2
#set format y2 "%3.0f"
#set y2range [0:200]
#set y2tics 32
#set rmargin 9
set datafile separator "\t"
set label 1 "LED 1 = LED 11" at 2.100,110 right font "arialbd,18"
set arrow from 2.100,110 to 2.110,103 lt 1 lw 2 lc 0
plot    \
"$1" index 0:9 using (\$5/1000):(\$2/1000):(column(-2)) with linespoints lw 2 lc variable,\
"$1" index 10 using (\$5/1000):(\$2/1000) with linespoints lw 2 lc 0
EOF
And the Arduino source code, which bears a remarkable resemblance to the original firmware:
// LED Curve Tracer
// Ed Nisley - KE4ANU - December 2012

#include <stdio.h>

//----------
// Pin assignments

const byte PIN_READ_LEDSUPPLY = 0;    // AI - LED supply voltage        blue
const byte PIN_READ_VDRAIN = 1;        // AI - drain voltage            red
const byte PIN_READ_VSOURCE = 2;    // AI - source voltage            orange
const byte PIN_READ_VGATE = 3;        // AI - VGS after filtering        violet

const byte PIN_SET_VGATE = 11;        // PWM - gate voltage            brown

const byte PIN_BUTTON1 = 8;            // DI - button to start tests    green
const byte PIN_BUTTON2 = 7;            // DI - button for options        yellow

const byte PIN_HEARTBEAT = 13;        // DO - Arduino LED
const byte PIN_SYNC = 2;            // DO - scope sync output

//----------
// Constants

const int MaxCurrent = 100;                // maximum LED current - mA
const int ISTEP = 10;                    // LED current increment

const float Vcc = 4.930;                // Arduino supply -- must be measured!

const float RSense = 10.500;            // current sense resistor

const float ITolerance = 0.0005;        // current setpoint tolerance

const float VGStep = 0.019;                // increment/decrement VGate = 5 V / 256

const byte PWM_Settle = 5;                // PWM settling time ms

#define TCCRxB 0x01                        // Timer prescaler = 1:1 for 32 kHz PWM

#define MK_UL(fl,sc) ((unsigned long)((fl)*(sc)))
#define MK_U(fl,sc) ((unsigned int)((fl)*(sc)))

//----------
// Globals

float AVRef1V1;                    // 1.1 V bandgap reference - calculated from Vcc

float VccLED;                    // LED high-side supply

float VDrain;                    // MOSFET terminal voltages
float VSource;
float VGate;

unsigned int TestNum = 1;

long unsigned long MillisNow;

//-- Read AI channel
//      averages several readings to improve noise performance
//        returns value in mV assuming VCC ref voltage

#define NUM_T_SAMPLES    10

float ReadAI(byte PinNum) {

word RawAverage;

digitalWrite(PIN_SYNC,HIGH);                // scope sync

RawAverage = analogRead(PinNum);            // prime the averaging pump

for (int i=2; i <= NUM_T_SAMPLES; i++) {
RawAverage += (word)analogRead(PinNum);
}

digitalWrite(PIN_SYNC,LOW);

RawAverage /= NUM_T_SAMPLES;

return Vcc * (float)RawAverage / 1024.0;

}

//-- Set PWM output

void SetPWMVoltage(byte PinNum,float PWMVolt) {

byte PWM;

PWM = (byte)(PWMVolt / Vcc * 255.0);

analogWrite(PinNum,PWM);
delay(PWM_Settle);

}

//-- Set VGS to produce desired LED current
//        bails out if VDS drops below a sensible value

void SetLEDCurrent(float ITarget) {

float ISense;                // measured current
float VGateSet;            // output voltage setpoint
float IError;                // (actual - desired) current

VGate = ReadAI(PIN_READ_VGATE);                    // get gate voltage
VGateSet = VGate;                                    //  because input may not match output

do {

VSource = ReadAI(PIN_READ_VSOURCE);
ISense = VSource / RSense;                        // get LED current

//    printf("\r\nITarget: %lu mA",MK_UL(ITarget,1000.0));
IError = ISense - ITarget;

//    printf("\r\nISense: %d mA VGateSet: %d mV VGate %d IError %d mA",
//           MK_U(ISense,1000.0),
//           MK_U(VGateSet,1000.0),
//           MK_U(VGate,1000.0),
//           MK_U(IError,1000.0));

if (IError < -ITolerance) {
VGateSet += VGStep;
//      Serial.print('+');
}
else if (IError > ITolerance) {
VGateSet -= VGStep;
//      Serial.print('-');
}

VGateSet = constrain(VGateSet,0.0,Vcc);
SetPWMVoltage(PIN_SET_VGATE,VGateSet);

VDrain = ReadAI(PIN_READ_VDRAIN);        // sample these for the main loop
VGate = ReadAI(PIN_READ_VGATE);
VccLED = ReadAI(PIN_READ_LEDSUPPLY);

if ((VDrain - VSource) < 0.020) {            // bail if VDS gets too low
printf("# VDS=%d too low, bailing\r\n",MK_U(VDrain - VSource,1000.0));
break;
}

} while (abs(IError) > ITolerance);

//    Serial.println(" Done");
}

//-- compute actual 1.1 V bandgap reference based on known VCC = AVcc (more or less)
//        adapted from http://code.google.com/p/tinkerit/wiki/SecretVoltmeter

float ReadBandGap(void) {

word ADCBits;
float VBandGap;

ADMUX = _BV(REFS0) | _BV(MUX3) | _BV(MUX2) | _BV(MUX1);    // select 1.1 V input
delay(2); // Wait for Vref to settle

ADCSRA |= _BV(ADSC);                                        // Convert
while (bit_is_set(ADCSRA,ADSC));

ADCBits = ADCL;
ADCBits |= ADCH<<8;

VBandGap = Vcc * (float)ADCBits / 1024.0;
return VBandGap;
}

//-- Print message, wait for a given button press

void WaitButton(int Button,char *pMsg) {
printf("# %s",pMsg);
while(HIGH == digitalRead(Button)) {
delay(100);
digitalWrite(PIN_HEARTBEAT,!digitalRead(PIN_HEARTBEAT));
}

delay(50);                // wait for bounce to settle
digitalWrite(PIN_HEARTBEAT,LOW);
}

//-- Helper routine for printf()

int s_putc(char c, FILE *t) {
Serial.write(c);
}

//------------------
// Set things up

void setup() {
pinMode(PIN_HEARTBEAT,OUTPUT);
digitalWrite(PIN_HEARTBEAT,LOW);    // show we arrived

pinMode(PIN_SYNC,OUTPUT);
digitalWrite(PIN_SYNC,LOW);        // show we arrived

TCCR1B = TCCRxB;                    // set frequency for PWM 9 & 10
TCCR2B = TCCRxB;                    // set frequency for PWM 3 & 11

pinMode(PIN_SET_VGATE,OUTPUT);
analogWrite(PIN_SET_VGATE,0);        // force gate voltage = 0

pinMode(PIN_BUTTON1,INPUT_PULLUP);    // use internal pullup for buttons
pinMode(PIN_BUTTON2,INPUT_PULLUP);

Serial.begin(9600);
fdevopen(&s_putc,0);                // set up serial output for printf()

printf("# LED Curve Tracer\r\n# Ed Nisley - KE4ZNU - December 2012\r\n");

VccLED = ReadAI(PIN_READ_LEDSUPPLY);
printf("# VCC at LED: %d mV\r\n",MK_U(VccLED,1000.0));

AVRef1V1 = ReadBandGap();            // compute actual bandgap reference voltage
printf("# Bandgap reference voltage: %lu mV\r\n",MK_UL(AVRef1V1,1000.0));

}

//------------------
// Run the test loop

void loop() {

Serial.println('\n');                        // blank line for Gnuplot indexing

WaitButton(PIN_BUTTON1,"Insert LED, press button 1 to start...\r\n");
printf("# INOM\tILED\tVccLED\tVD\tVLED\tVG\tVS\tVGS\tVDS\t<--- LED %d\r\n",TestNum++);
digitalWrite(PIN_HEARTBEAT,LOW);

for (int ILED=0; ILED <= MaxCurrent; ILED+=ISTEP) {
SetLEDCurrent(((float)ILED)/1000.0);
printf("%d\t%lu\t%d\t%d\t%d\t%d\t%d\t%d\t%d\r\n",
ILED,
MK_UL(VSource / RSense,1.0e6),
MK_U(VccLED,1000.0),
MK_U(VDrain,1000.0),
MK_U(VccLED - VDrain,1000.0),
MK_U(VGate,1000.0),
MK_U(VSource,1000.0),
MK_U(VGate - VSource,1000),
MK_U(VDrain - VSource,1000.0)
);
}

SetPWMVoltage(PIN_SET_VGATE,0.0);

}
I want to stress-test some LEDs for the long-stalled bike taillight project with a high current / low duty cycle drive. The usual specs give something like 100 mA at 10% duty cycle in a 100 μs period, but maybe they’ll withstand more abuse than that; I don’t have any specs whatsoever for these LEDs. The usual DC rating is 20 mA, so 100 mA at 20%, say 2 ms in a 10 ms period, should give the same average power as the DC spec. I plan to run them continuously until some failures to pop up or it’s obvious they’re doing just fine.
Although this would be a dandy Arduino project, a classic 555 timer IC makes more sense for something that must run continuously without changing anything. The usual 555 circuit restricts the duty cycle to more than 50% for high-active pulses, a bit over the 20% this task calls for. The simplest workaround is a Schottky diode across the discharge resistor to separate the two current paths: charge uses the upper resistor, discharge the lower, with the diode forward drop thrown in to complicate the calculations.
Rather than putz around with calculation, a few minutes iterating with Linear Technologies’ LTSpice IV produces a reasonable result:
NE555 pulse generator
In round numbers, a 1 μF timing capacitor, 2.7 kΩ charge resistor, and 13 kΩ discharge resistor do the trick. Given the usual capacitor tolerances, each resistor should include a twiddlepot of about half the nominal value: 1 kΩ and 5 kΩ, respectively.
I’m thinking of repurposing those Wouxun KG-UV3D batteries for this task and found a 7.5 V 3.5 A wall wart in the heap that will be close enough for the test rig. The 555 output should drive a logic-level MOSFET just fine, although even an ordinary FET would probably be OK for the relatively low current required for LED toasting.
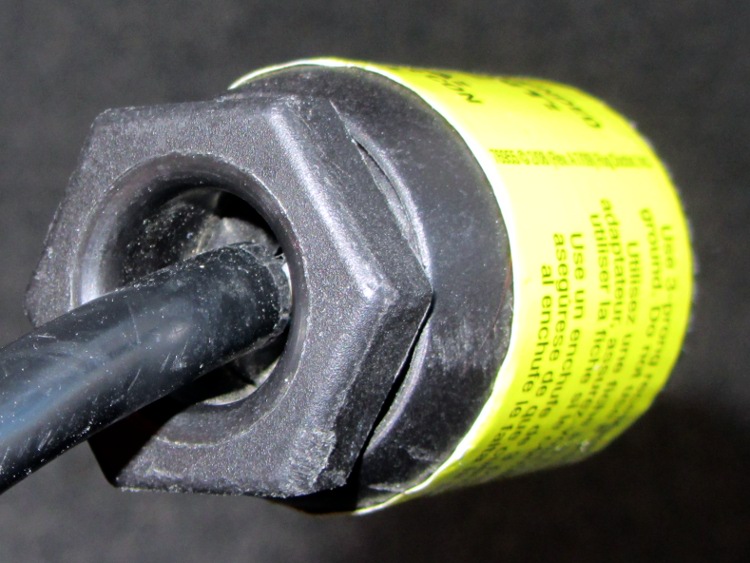
Driven by forces beyond my control, I had to rent a carpet cleaner from a local Big Box home repair store. The rugged line cord plug had an unusual (to me, anyway) strain relief fitting on the back, consisting of a circumferential clamp around the cord and a large diameter, deeply recessed opening on the nut to prevent the cord from flexing sharply:
AC Line Cord Plug – clamp nut
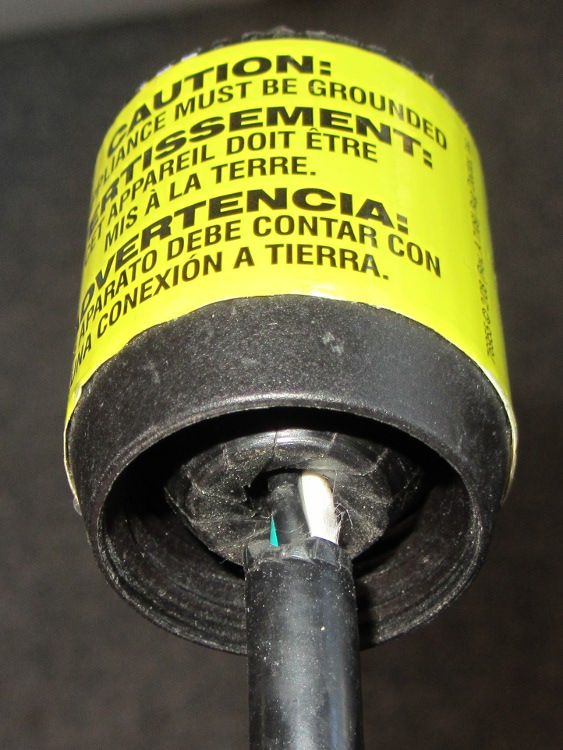
But something seemed odd, so I unscrewed the finger-tight clamping nut:
AC Line Cord Plug – clamp fingers
Whoever installed the cord cut the insulation back far too much, as those fingers should close on the insulation jacket, not the conductors.
I fought down my instinctive response, took a deep breath, clicked my heels together three times, repeated “This is not my problem”, and suddenly it wasn’t my problem any more. I tried reporting it to the harried clerk at the Big Box Store, but she instantly fluttered off to help somebody else after noting my return in the Big Book of Rental Contracts.
Having been unable to find a single listing of all the ARRL Hands-On Radio columns(*) by Ward Silver, N0AX, in QST magazine, I scraped their lists, did some cleanup, and roughly categorized each column’s topic. If you want to bootstrap yourself (or someone you know) from zero to pretty good, he can get you there!
[Update: (*) You must be an ARRL member to access the collection, but you need not hold an amateur radio license…]
Exp
Title
DC
Audio
Digital
Power
RF
Theory
1
The Common-Emitter Amplifier
x
x
x
x
2
The Emitter-Follower Amplifier
x
x
x
x
3
Basic Operational Amplifiers
x
x
x
4
Active Filters
x
x
5
The Integrated Timer
x
6
Rectifiers and Zener References
x
x
7
Voltage Multipliers
x
x
8
The Linear Regulator
x
x
9
Designing Drivers
x
x
x
x
10
Using SCRs
x
x
11
Comparators
x
x
x
x
12
Field Effect Transistors
x
x
x
x
x
x
13
Attenuators
x
x
x
14
Optocouplers
x
x
x
15
Switchmode Regulators, Part 1
x
x
16
Switchmode Regulators, Part 2
x
x
17
The Phase-Shift Oscillator
x
x
x
18
Frequency Response
x
x
x
19
Current Sources
x
x
x
20
The Differential Amplifier
x
x
21
The L-Network
x
x
22
Stubs
x
x
23
Open House in the N0AX Lab
24
Heat Management
x
x
25
Totem Pole Outputs
x
x
x
x
26
Solid-State RF Switches
x
27
Scope Tricks
x
x
x
x
x
x
28
The Common Base Amplifier
x
x
x
x
29
Kirchhoff’s Laws
x
x
x
30
The Charge Pump
x
x
x
x
31
The Multivibrator
x
x
x
32
Thevenin Equivalents
x
33
The Transformer
x
x
x
x
34
Technical References
x
35
Power Supply Analysis
x
x
x
36
The Up-Down Counter
x
37
Decoding for Display
x
38
Battery Charger
x
x
39
Battery Charger, Part 2
x
x
40
VOX
x
41
Damping Factor
x
x
x
42
Notch Filters
x
x
x
43
RF Oscillators, Part 1
x
x
44
RF Oscillators, Part 2
x
x
45
RF Amplifiers, Part 1
x
x
x
46
Two Cs: Crystal and Class
x
x
47
Toroids
x
x
48
Baluns
x
x
49
Reading and Drawing Schematics
x
50
Filter Design 1
x
x
x
51
Filter Design 2
x
x
x
52
SWR Meters
x
53
RF Peak Detector
x
x
x
54
Precision Rectifiers
x
x
55
Current/Voltage Converters
x
x
x
x
56
Design Sensitivities
x
57
Double Stubs
x
58
Double Stubs II
x
59
Smith Chart Fun I
x
x
60
Smith Chart Fun 2
x
x
61
Smith Chart Fun 3
x
x
62
About Resistors
x
x
x
x
63
About Capacitors
x
x
x
x
64
Waveforms and Harmonics
x
x
x
x
x
65
Spectrum Modification
x
x
x
66
Mixer Basics
x
x
x
x
67
The Return of the Kit
68
Phase Locked Loops, the Basics
x
x
x
x
69
Phase Locked Loops, Applications
x
x
x
70
Three-Terminal Regulators
x
x
x
71
Circuit Layout
x
x
x
x
x
x
72
Return Loss and S-Parameters
x
x
73
Choosing an Op Amp
x
x
x
74
Resonant Circuits
x
x
x
75
Series to Parallel Conversion
x
x
76
Diode Junctions
x
x
x
77
Load Lines
x
x
x
x
78
Bridge Circuits
x
x
x
79
Pi and T Networks
x
x
x
80
Battery Capacity
x
x
x
81
Synchronous Transformers
x
x
82
Antenna Height
x
x
83
Circuit Simulation, Part One
x
x
x
x
x
x
83
Circuit Simulation, Build and Test
x
x
x
x
x
x
85
Circuit Simulation, Complex Parts
x
x
x
x
x
x
86
Viewing Waveforms in LTspice
x
x
x
x
x
87
Elsie Filter Design, Part 1
x
x
88
Elsie Filter Design, Part 2
x
x
89
Overvoltage Protection
x
x
x
x
90
Construction Techniques
x
x
x
x
91
Common Mode Choke
x
x
x
92
The 468 Factor
x
x
93
An LED AM Modulator
x
94
SWR and Transmission Line Loss
x
x
95
Watt’s In a Waveform?
x
x
x
x
x
96
Open Wire Transmission Lines
x
97
Programmable Frequency Reference
x
x
x
98
Linear Supply Design
x
x
x
99
Cascode Amplifier
x
x
x
x
100
Hands-On Hundred
101
Rotary Encoders
x
102
Detecting RF, Part 1
x
x
x
x
103
Detecting RF, Part 2
x
x
x
x
104
Words to Watch For
x
105
Gain-Bandwidth Product
x
x
x
x
106
Effects of Gain-Bandwidth Product
x
x
x
107
PCB Layout, Part 1
x
x
x
x
x
x
108
PCB Layout, Part 2
x
x
x
x
x
x
109
PCB Layout, Part 3
x
x
x
x
x
x
110
PCB Layout, Part 4
x
x
x
x
x
x
111
Coiled-Coax Chokes
x
112
RFI Hunt
x
x
113
Radiation Patterns
x
x
114
Recording Signals
x
x
115
All About Tapers
x
x
116
The Quarter-Three-Quarter Wave Balun
x
117
Laying Down the Laws
x
118
The Laws at Work
x
119
The Q3Q Balun Redux
x
120
Power Polarity Protection
x
x
Corrections, amendations, commentary? Let me know…
The epoxy usually has some fluorescence, but this seems more dramatic than usual. In any event, the die’s wide beam angle shows clearly; the beam along the axis out in front is actually pretty tight.
It’s sitting on the back of a white ceramic tile and the colors came out surprisingly close to real life.
Adding this to an Arduino would follow the same logic as, say, the pager motor: power the LED + resistor + MOSFET from a +5 V external regulator that won’t heat the Arduino board, then define an unused bit in the shift register as, say UV_LED.