A test pattern with a grayscale of 1 mm bars:

There is a 1 mm white bar to the left of the leftmost black bar as a scope trace marker and 2 mm white bar to the right of the rightmost black bar for direction confirmation.
Setting the image to 254 dpi = 10 pix/mm makes the bars exactly 10 pixels wide and scanning at 100 mm/s makes them 10 ms wide. They’re tall enough to simplify scope triggering and capture.
Although using a black bar for 0% PWM = 0 mA and a white bar for 100% PWM makes numerical sense, at least to me, it’s the other way around for laser cutting / engraving: black = 100% and white = 0%. With the layer set to Fill in LightBurn, turn the layer’s Negative Image switch on, and everything comes out right.
Engraving a good grayscale or 3D image is a can of worms, so I just fired the beam into a shallow pan of water.
With signals and traces arranged as before, the beam current shows the same huge spikes during the 10% and 20% PWM bars and at the start of the 100% PWM bars:
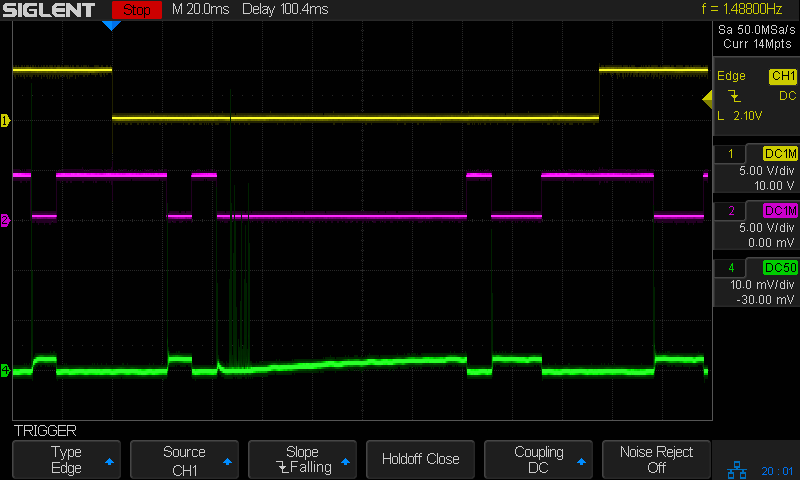
At 100 mA/div, those spikes look to be 400 mA tall.
A closer look with the current scaled to 10 mA/div:

The controller sets L-ON high whenever the beam current should be zero, so the power supply is disabled during the 0% PWM bars. Note the descending glitch at the start of the 10% PWM bar: perhaps the power supply stayed all charged up from the 100% white bar on the left edge and took a few milliseconds to begin tracking the lower current setting.
Each step of what should be a stairway from 10% to 100% PWM has about 2 ms of good old single-pole response. The steps from 70% upward have enough ripple to obscure the steps; the rightmost 100% PWM bar show the ripple doesn’t damp down for 20 ms.
Eyeballometrically, the ramp compresses on the high-current end: equal PWM steps produce less current per step. The current spikes make PWM values of 10% to 20% look awful, PWM between 30% and 50% seem more linear, and increments beyond 60% are rather compressed. The slight nonlinearity makes no practical difference, particularly because the usual recommendation is to not exceed 70%-ish PWM to prolong the tube life.
A continuous grayscale gradient:

As before, there’s a 1 mm white bar on the left and a 2 mm white bar on the right, with the image inverted to make the white bars 100% PWM.
Apparently the power supply can’t regulate the current down from the 100% PWM bar fast enough to match the 0% PWM start of the ramp:

The compressed relation between PWM and current shows there’s definitely not much benefit in driving the tube beyond about 60% PWM.
There are no high-current spikes in that screenshot, despite having a 0% to 100% PWM gradient.
Unlike the gray bars in the first test image up top, this is a continuous ramp and shouldn’t have any discontinuities. The vertical cursors span eight ripples and sit 66 ms apart, which works out to 8.25 ms/ripple. Flip it upside down and you’re looking at 120 Hz ripple from the full-wave bridge rectifier feeding the high-voltage converter. You’d expect solid low-pass filtering after the high-frequency flyback transformer, so the input filter must have the smallest possible caps the designers could possibly use.
Another smooth gradient preceded by a 10% PWM bar and bracketed by the same white bars:

The current waveform is … odd:

The high-current spikes following the 100% PWM bar on the left occupy the 10% PWM bar and the start of the gradient, up to about 20% PWM. Apparently the spikes happen while the power supply attempts to produce more-or-less continuous current at PWM values below about 25%
And I thought this was going to be simple …

Comments
2 responses to “CO₂ Laser Tube Current: Variable Power”
[…] that for the 8 ms pulse), for an average current of 40 µA·s / 4 ms = 10 ma. Having previously established 100% PWM corresponds to 24 mA, 40% of 24 mA = 9.6 mA seems about as close as one might […]
[…] The analog-mode current looks remarkably like the PWM-mode current for the same test pattern: […]