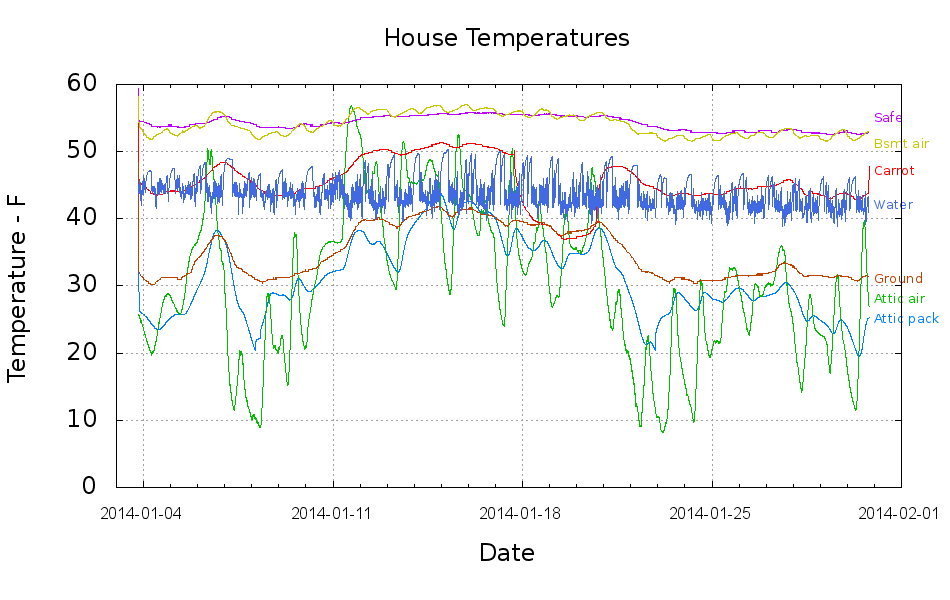
This collects the temperature data points from the Hobo data loggers for the last month:
Things to ponder:
- The carrot buckets sat under the patio at the start of the month and moved indoors twice, marked by the humps. The early part of their curve doesn’t track the patio ground temperature nearly as well as it did during the three days at 18 Jan. We’re not sure why.
- The water temperature sensor clamps to the copper pipe just inside the wall, so the low points measure outdoor water on its way past. The high points rise toward the basement air temperature (measured a few feet away), but the wall / earth around the pipe holds it below the air.
- The basement safe looks like a good proxy for the average daily air temperature.
- The attic insulation I added long ago seems to be working hard & doing swell.
I cleaned up the data files manually, using those sed pipes, because of inadequate Bash-fu; I can’t figure out how to escape-quote the input file names and make temporary files work inside a Bash for;do;end construct that would rip through all the CSV files in one shot.
On the other paw, the chart came out pretty well; I can now specify X-axis date ranges with some assurance of getting the right results.
The Bash / Gnuplot script that made it happen:
#!/bin/sh
#-- overhead
export GDFONTPATH="/usr/share/fonts/truetype/"
ofile=Temperatures.png
echo Output file: ${ofile}
#-- do it
gnuplot << EOF
#set term x11
set term png font "arialbd.ttf" 18 size 950,600
set output "${ofile}"
set title "House Temperatures"
set key noautotitles left bottom
unset mouse
set bmargin 4
set grid xtics ytics
set timefmt "%m/%d/%Y %H:%M:%S"
set xdata time
set xlabel "Date"
set format x "%Y-%m-%d"
set xrange ["01/03/2014":]
set xtics font "arial,12"
#set mxtics 2
#set logscale y
#set ytics nomirror autofreq
set ylabel "Temperature - F"
#set format y "%4.0f"
#set yrange [30:90]
#set mytics 2
#set y2label "right side variable"
#set y2tics nomirror autofreq 2
#set format y2 "%3.0f"
#set y2range [0:200]
#set y2tics 32
#set rmargin 9
set datafile separator ","
set label 1 "Attic pack" at "01/31/2014",25 left font "arialbd,10" tc lt 3
set label 2 "Attic air"  at "01/31/2014",28 left font "arialbd,10" tc lt 2
set label 3 "Safe"       at "01/31/2014",55 left font "arialbd,10" tc lt 4
set label 4 "Carrot"     at "01/31/2014",47 left font "arialbd,10" tc lt 1
set label 5 "Ground"     at "01/31/2014",31 left font "arialbd,10" tc lt 6
set label 6 "Bsmt air"   at "01/31/2014",51 left font "arialbd,10" tc lt 7
set label 7 "Water"      at "01/31/2014",42 left font "arialbd,10" tc lt 8
#set arrow from 2.100,110 to 2.105,103 lt 1 lw 2 lc 0
plot	\
    "Attic.csv"  using 2:3 with lines lt 3 lw 1,\
    "Attic.csv"  using 2:4 with lines lt 2 lw 1,\
    "Safe.csv"   using 2:3 with lines lt 4 lw 1,\
    "Carrot.csv" using 2:3 with lines lt 1 lw 1,\
    "Patio.csv"  using 2:3 with lines lt 6 lw 1,\
    "Water.csv"  using 2:3 with lines lt 7 lw 1,\
    "Water.csv"  using 2:5 with lines lt 8 lw 1

EOF

Comments
2 responses to “Monthly Science: Air Temperatures”
If you show me a for;do loop that almost does what you want but not quite, either here or via email, I may be able to give you the last bit of fu to make it work.
I must email it, because WordPress insists on capturing the escaped characters, but I’ll definitely post your solution!
Thanks…