-
Monthly Science: Town Water Inlet Temperature
Back in 2006, I clamped a Hobo temperature sensor onto the pipe that delivers town water from the main, under 150 feet of front yard, and into our basement:
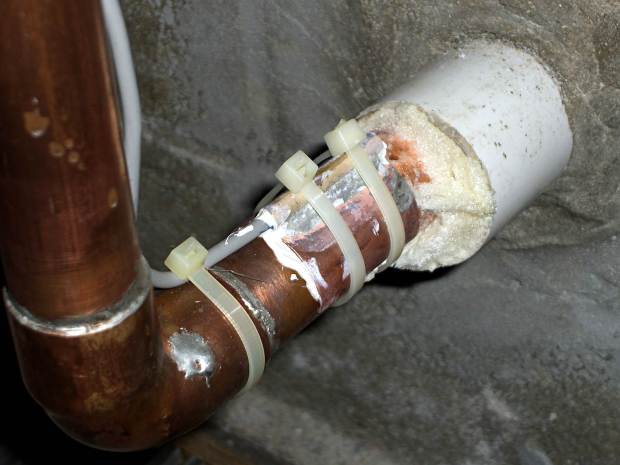
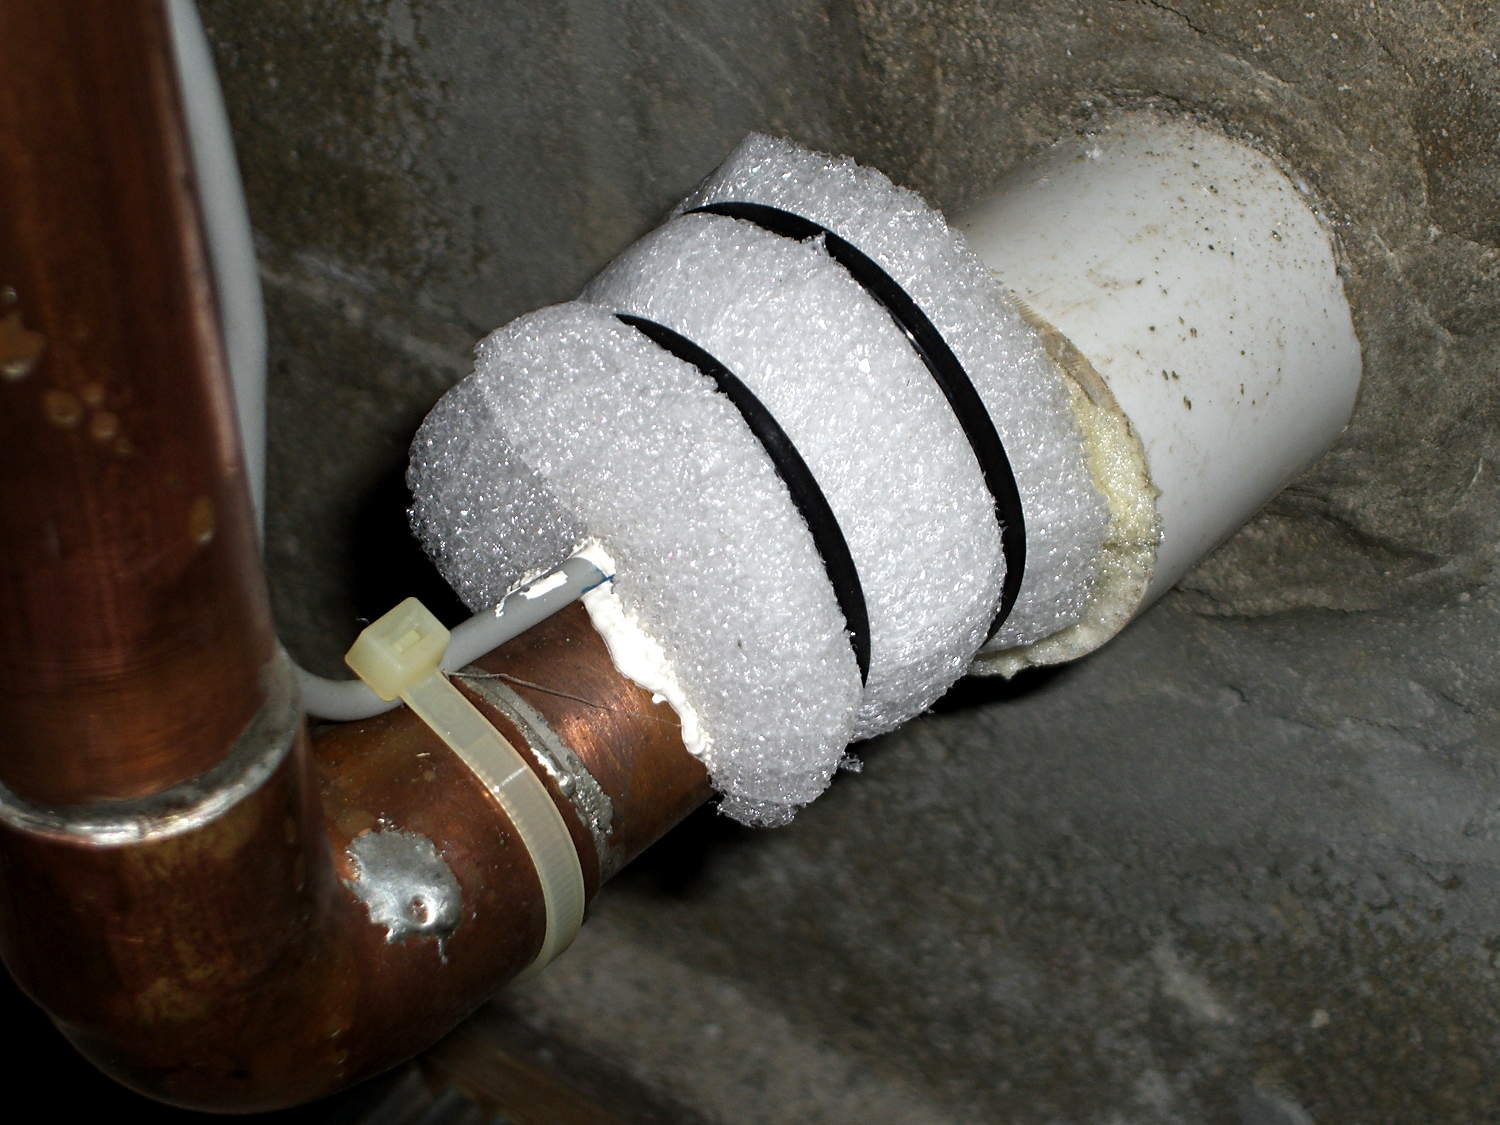
Town Water Inlet – temperature sensor mounting Wrapping a chunk of closed-cell foam insulation around it made me feel better, but probably doesn’t affect the results very much at all:
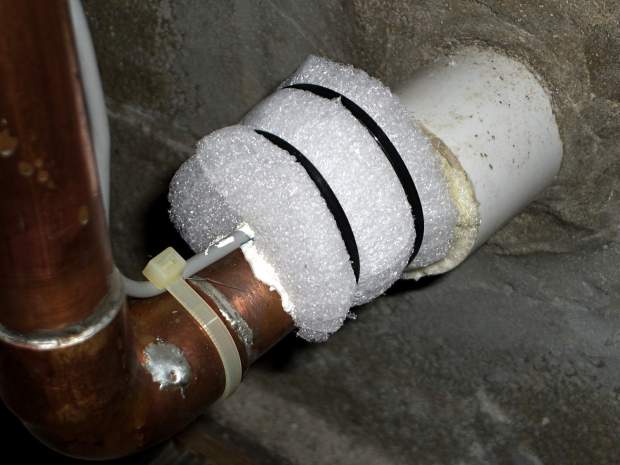
Town Water Inlet – temperature sensor insulation I assume the temperature of the pipe at that location will match the water temperature pretty closely, at least while some water flows into the house, and the water temperature will match the ground temperature four feet under the front yard.
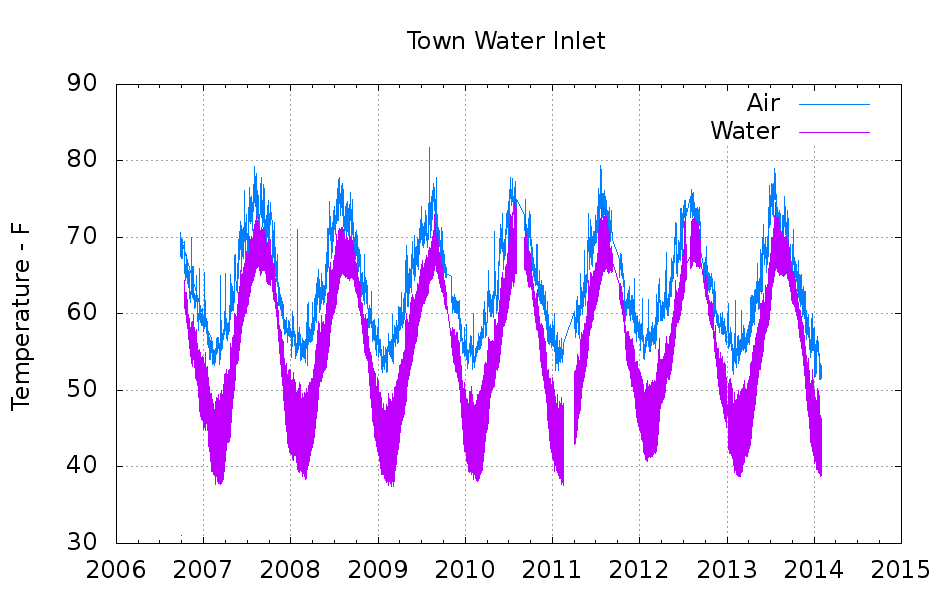
Under those assumptions, the bottom trace shows the pipe temperature and the top trace shows the air temperature on the shelf a few feet above the pipe:
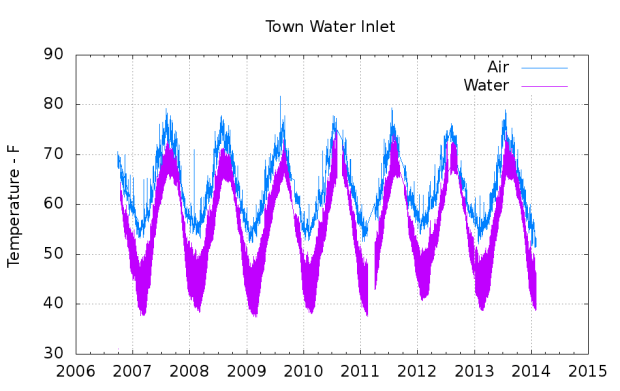
Town Water Inlet The gap in early 2011 documents an embarrassing bit of forgetfulness. All in all, you’re looking at about 750,000 logged records; if you observe something long enough, it turns into science.
Cleaning up the date and time columns in the data files required a few hours of heads-down
sedexperimentation:- Convert quoted headers to comments →
s/^\"/#&/ - Convert non-data records to comments →
s/^.*Logged/#&/ - Convert two-digit years to four-digit years and enforce trailing blank →
s_/\([01][0-9]\)[ ,]_/20\1 _ - Enforce blank after four-digit years →
s_/\(20[0-9]\{2\}\),_/\1 _ - Remove blank after time-of-day value →
s_\(:[0-9]\{2\}\) _\1_
Being reminded that
sedwill accept (nearly) any delimiter character came in handy!The temperature spikes happen when I bring the Hobo datalogger upstairs to read it out. The plotting routine discards the junk readings caused by unplugging the remote sensor; anything below 30 °F or above 100 °F counts as spurious. The gnuplot idiom uses the ternary operator with the
Not-a-Numbervalue:plot "filename" using 2:((\$3 > 30) && (\$3 < 100) ? \$3 : NaN) with ...</code>
The backslashes escape gnuplot’s variable markers, which would otherwise get eaten by Bash.
The Bash / gnuplot script that produces the plot:
#!/bin/sh #-- overhead export GDFONTPATH="/usr/share/fonts/truetype/" base="${1%.*}" echo Base name: ${base} tfile1=$(tempfile) ofile=${base}.png echo Input file: $1 echo Temporary files: ${tfile1} echo Output file: ${ofile} #-- prepare csv Hobo logger file sed 's/^\"/#&/ ; s/^.*Logged/#&/ ; s_/\([01][0-9]\)[ ,]_/20\1 _ ; s_/\(20[0-9]\{2\}\),_/\1 _ ; s_\(:[0-9]\{2\}\) _\1_' "$1" > ${tfile1} #-- do it gnuplot << EOF set term png font "arialbd.ttf" 18 size 950,600 set output "${ofile}" set title "${base}" set key noautotitles unset mouse set grid xtics ytics set timefmt "%m/%d/%Y %H:%M:%S" set xdata time #set xlabel "Week of Year" set format x "%Y" set ylabel "Temperature - F" set yrange [30:90] set datafile separator "," plot \ "${tfile1}" using 2:((\$3 > 30) && (\$3 < 100) ? \$3 : NaN) with lines lt 3 title "Air", \ "${tfile1}" using 2:((\$5 > 30) && (\$5 < 100) ? \$5 : NaN) with lines lt 4 title "Water" EOF - Convert quoted headers to comments →
-
Subscribe
Subscribed
Have a WordPress.com account? Log in now.

