-
LF Crystal Tester: 60 kHz Resonator Frequency Distribution
Histogramming all 50-ish resonator frequencies shows reasonably good distributions:
Notably, there’s no obvious suckout in the middle, as with those eBay Hall-effect sensors.
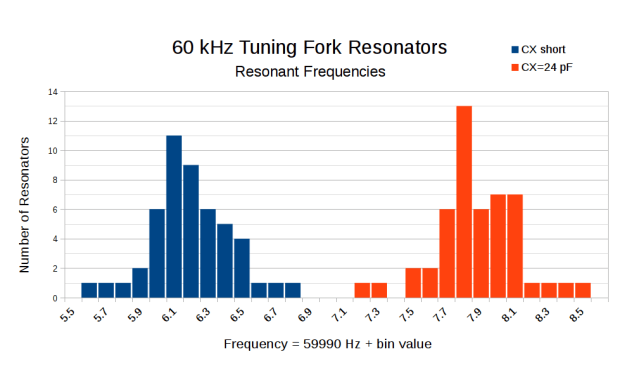
60 kHz Resonant Frequencies – CX 24 pF – histogram I don’t know what to make of the difference between the
parallelseries-capacitor and basic serial resonant frequencies for each tuning fork: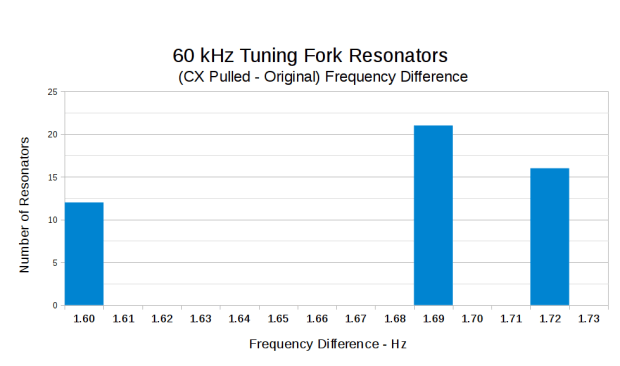
60 kHz Resonant Frequencies – CX 24 pF – delta histogram Perhaps each resonator’s frequency depends on its (laser-trimmed) tine mass and follows a more-or-less normal distribution, but the
parallel-serial differenceseries capacitor changes the frequency based on (well-controlled) etched dimensions producing quantized results from three different masks / wafers / lots, with the motional inductance and capacitance incompletely modeling the physics?For reference, the resonators look like this:
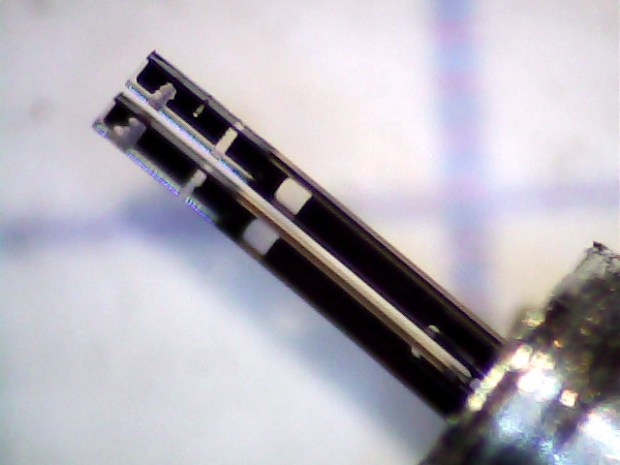
Quartz resonator – detail Producing the histograms uses the LibreOffice
frequency()array function, which requires remembering to whackCtrl-Shift Enterto activate the function’s array-ness.[Update: Faceplant about “parallel” resonance, which is actually the shifted resonant peak due to the 24 pF series cap. Apparently I typo-ed the second histogram subheading and ran with the error; the figures are now correct.]


-
Subscribe
Subscribed
Have a WordPress.com account? Log in now.

