-
CO₂ Laser Tube Current: Constant Power
The test pattern consists of 1 mm blocks:

Pulse Timing Pattern – 1 mm blocks I set the layer speed at 250 mm/s = 4 ms / mm, then set PWM (a.k.a. “power”) for each test, and measured the results, which look like this for three power levels on corrugated cardboard:

Pulse Timing Pattern – cardboard – 10 20 30 pct The scan interval of 0.2 mm produces distinct lines at 10% PWM, the lower limit of the laser’s range. The lines remain separate at 30%, although their width is definitely increasing.
Yesterday’s post explains the test wiring setup and the signals in the scope screenshots.
The 10% PWM current waveform looks like nothing you’d expect:

Tube Current – 10pct – 250mm-s – 5ma-div The scope triggers at the start of a left-to-right scan line, with 50 ms devoted to ramping up the speed to 250 mm/s before the start of the vertical bar along the left edge and slowing down before reversing.
The green trace shows huge spikes in the laser current, not a well-defined DC current pulse, and they’re offscale beyond 30 mA at 5 mA/div. The baseline sits well above the 0 V line due to the AM502 amplifier’s breathtaking thermal drift; I occasionally touch it up, but the current really is zero between the pulses.
Similarly for 20% PWM:

Tube Current – 20pct – 250mm-s – 5ma-div Even through there’s little visible difference between the 10% and 20% current waveforms, there’s a distinct difference in the actual beam power delivered to the cardboard.
At 30% PWM the beam current looks a bit more reasonable:

Tube Current – 30pct – 250mm-s – 5ma-div The 2 mm = 8 ms bar on the right gives the current time to stabilize at 6 mA, but all of the pulses have at least 3 ms of spikes. The first pulse definitely looks worse, so it seems the power supply gets better as the scan line progresses.
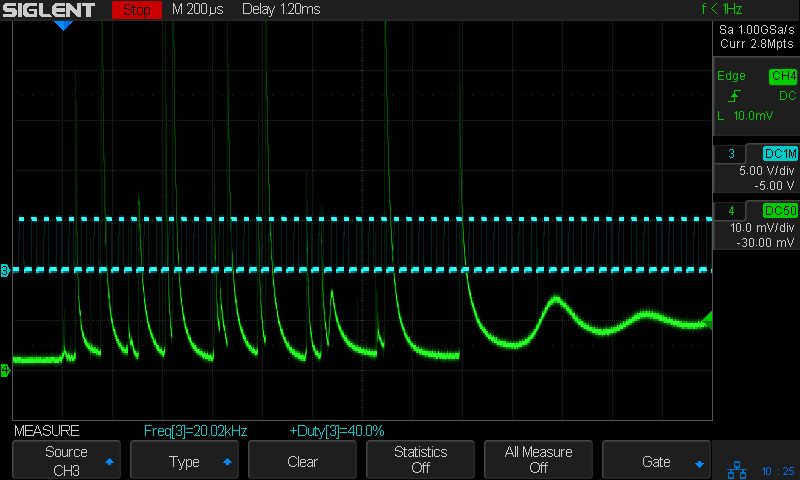
At 40% PWM the beam current pulses look more like pulses:

Tube Current – 40pct – 250mm-s – 5ma-div They still have 3 ms or so of those startup spikes, as seen in this closer look at the first pulse in a line, scaled at 10 mA/div (along with the PWM drive signal):
Tube Current – 40pct PWM first detail – 250mm-s – 10ma-div The top of those spikes exceed 70 mA!
At 80% PWM, the current waveform looks like a damped tank circuit:

Tube Current – 80pct first – 250mm-s – 5ma-div The 20 mA at the end of that pulse suggests the maximum tube current would be 25 mA, which is undoubtedly why OMTech recommends running at no more than 70% PWM = 17-ish mA.
The pulses start immediately after the L-ON signal goes active and stop promptly when it goes inactive, so there’s no question about the responsiveness. What baffles me is why the current looks the way it does.
I must figure out how to have the scope compute the RMS value of those spikes, with a sufficiently large mA/div setting to keep the entire range of the pulses on the screen.
-
Subscribe
Subscribed
Already have a WordPress.com account? Log in now.
