-
Gnuplot Datafile Formatting
The MOSFET tester spits out datasets using this tedious Arduino code:
void PrintHeader(void) {
  Serial.println();                         // Gnuplot group break
  Serial.println("#-----------------------------");
  Serial.print("# VGate: ");
  Serial.print(VGateSet,3);
  Serial.println();
  Serial.print("# TSetpoint: ");
  Serial.print(TSetpoint,1);
  Serial.println(" C");
  Serial.println("# VGS \tVDS \tID  \tRDS \tC   \tTime");
}

void PrintTempHeader() {
  Serial.println();                                    // Gnuplot index break
  Serial.println();
  Serial.print("#T=");                                //  ... index name
  Serial.println(TSetpoint,1);
  Serial.println("#=============================");
  Serial.print("# Setting temperature to: ");        // human-readable annotation
  Serial.print(TSetpoint,1);
  Serial.println(" C ...");
}

... later, deep inside the main loop ...

    Serial.print(VGateSet,3);
    Serial.print('\t');
    Serial.print(VDrainSense,3);
    Serial.print('\t');
    Serial.print(IDrainSense,3);
    Serial.print('\t');
    Serial.print((IDrainSense == 0.0) ? 0.0 : (VDrainSense / IDrainSense),3);
    Serial.print('\t');
    Serial.print(Temperature,1);
    Serial.print('\t');
    Serial.print(millis() - StartTime);
    Serial.println();
All that produces a text file formatted to work with Gnuplot, including a blank line between successive gate voltage groups to produce separate plot traces:
#T=0.0
#=============================
# Setting temperature to: 0.0 C ...

#-----------------------------
# VGate: 4.250
# TSetpoint: 0.0 C
# VGS 	VDS 	ID  	RDS 	C   	Time
4.250	1.200	0.000	0.000	1.0	1757
4.250	1.665	0.044	37.851	1.0	1861

#-----------------------------
# VGate: 4.500
# TSetpoint: 0.0 C
# VGS 	VDS 	ID  	RDS 	C   	Time
4.500	0.003	0.000	0.000	1.0	2038
4.500	0.016	0.044	0.370	1.0	2143
... snippage ...
4.500	0.212	1.953	0.108	0.9	6105
4.500	0.216	2.001	0.108	0.9	6210
Which produces a plot like this:
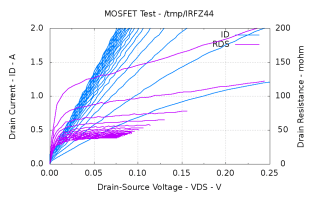
IRFZ44 It’d be handy to automatically generate labels for the gate voltages, but I haven’t been able to figure out how to read values from the dataset and plunk them into the label strings. You can, however, select blocks of gate voltage and superblocks of temperature with a bit of effort.
The Bash script that feeds Gnuplot looks something like this:
#!/bin/sh
#-- set plot limits
tx=3
vgs_min="4.0"
vds_max="0.2"
rds_max=100
rds_tics=$((${rds_max} / 4))
id_max="2.0"
#-- overhead
export GDFONTPATH="/usr/share/fonts/truetype/"
base="${1%.*}"
echo Base name: ${base}
ofile=${base}.png
echo Output file: ${ofile}
#-- do it
gnuplot << EOF
#set term x11
set term png font "arialbd.ttf" 18 size 950,600
set output "${ofile}"
set title "${base}"
set key noautotitles
unset mouse
set bmargin 4
set grid xtics ytics
set xlabel "Drain-Source Voltage - VDS - V"
set format x "%4.2f"
set xrange [0:${vds_max}]
#set xtics 0,5
set mxtics 2
set ytics nomirror autofreq
set ylabel "Drain Current - ID - A"
set format y "%4.1f"
set yrange [0:${id_max}]
#set mytics 2
set y2label "Drain Resistance - RDS - mohm"
set y2tics nomirror autofreq ${rds_tics}
set format y2 "%3.0f"
set y2range [0:${rds_max}]
#set y2tics 32
#set rmargin 9
set datafile separator "\t"
#set label 1 "Temp index = ${tx}" at 0.81,0.55 font "arialbd,18"
set label 2 "VGS >= ${vgs_min} V" at 0.11,0.55 font "arialbd,18"
plot    \
"$1" using 2:((\$1 >= ${vgs_min})?\$3:NaN)            index $tx:$tx           with lines lt 3 lw 2 title "ID" ,\
""   using 2:((\$1 >= ${vgs_min})?(\$4*1000):NaN)    index $tx:$tx axes x1y2 with lines lt 4 lw 2 title "RDS"
EOF
The variables up near the top control the plot limits; it’d be nice to have a complex Bash script that prompted for values, had useful defaults, and fed all that into Gnuplot. Given what I’m doing, it’s easier to just keep the Bash script open in the portrait monitor, watch the results on the landscape monitor, and twiddle until it looks right.
This script produces a plot for a single temperature range based on the superblock index tx; you can select a single block using index name (along the lines of “T=0.0”), but you can’t select multiple such blocks in a single plot statement.
Selecting gate voltages requires testing the first column for a match with the trinary operator and assigning the data value for lines that don’t match to the not-a-number value NaN to prevent it from appearing in the plot:
((\$1 >= ${vgs_min})?\$3:NaN)All in all, the whole apparat makes for a fairly brittle set of code, but the plots come out ready for printing and that makes up for a lot.

-
Subscribe
Subscribed
Already have a WordPress.com account? Log in now.
 The Smell of Molten Projects in the Morning