-
LED Curve Tracer: Repeatability
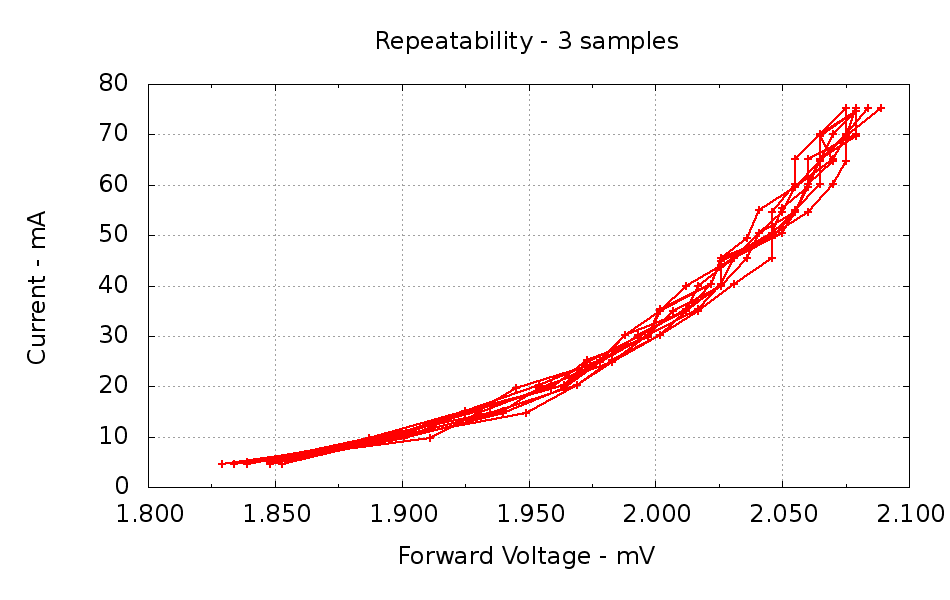
Measuring the same LED many times should produce the same data every time. Here’s an LED measured ten times in quick succession, with each data point consisting of the average of three ADC conversions:
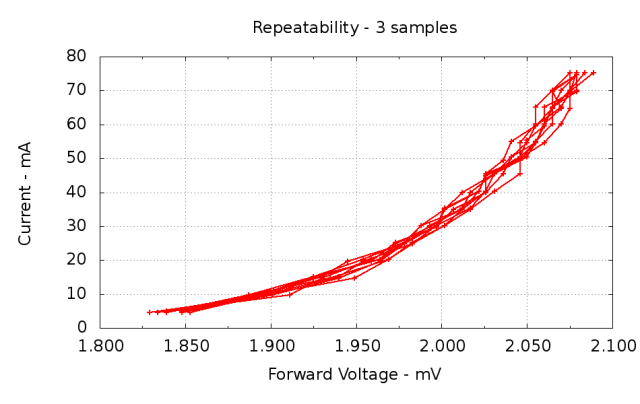
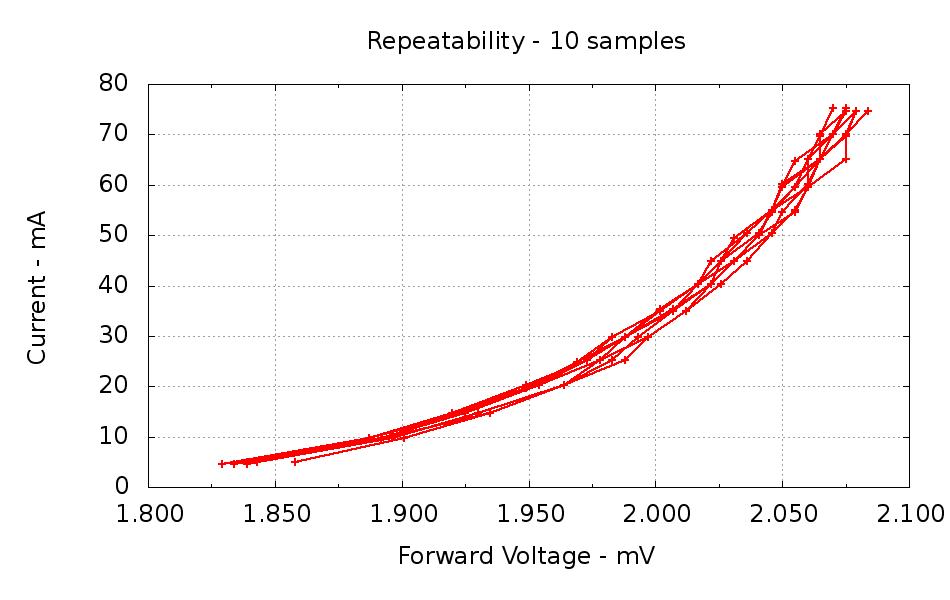
Repeatability – 3 samples Ten more measurements of the same LED, but with each data point being the average of ten ADC conversions:
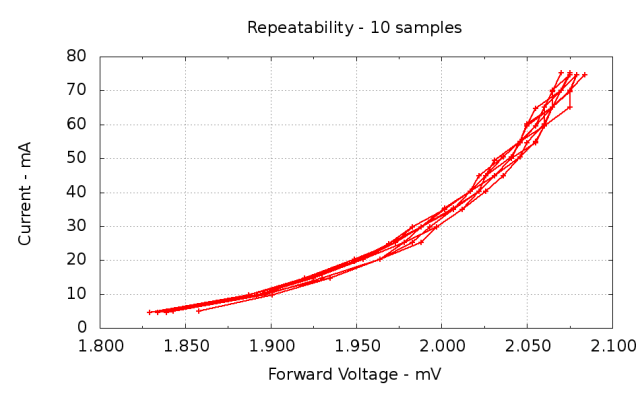
Repeatability – 10 samples Not much to choose between the two, although averaging more readings does reduce the scatter just a bit. The ADC resolution is 5 mV, which is painfully obvious along the X axis. The Y axis has a smaller spread because it’s the independent variable: the firmware sets the MOSFET gate voltage to produce a given current and the ADC steps are relatively larger (the input voltage is only 75 mA × 10.5 Ω = 800 mV, tops).
I think it’s close enough for my simple needs.
The ADC code looks like this:
//-- Read AI channel
// averages several readings to improve noise performance
// returns value in mV assuming VCC ref voltage

#define NUM_T_SAMPLES 10

float ReadAI(byte PinNum) {
  word RawAverage;

  digitalWrite(PIN_SYNC,HIGH); // scope sync

  RawAverage = analogRead(PinNum); // prime the averaging pump

  for (int i=2; i <= NUM_T_SAMPLES; i++) {
    RawAverage += (word)analogRead(PinNum);
  }

  digitalWrite(PIN_SYNC,LOW);

  RawAverage /= NUM_T_SAMPLES;
  return Vcc * (float)RawAverage / 1024.0;
}
And the Gnuplot routine that produces the graphs, including a bit of cruft that reminds me how to make two Y axis scales:
#!/bin/sh
#-- overhead
export GDFONTPATH="/usr/share/fonts/truetype/"
base="${1%.*}"
echo Base name: ${base}
ofile=${base}.png
echo Output file: ${ofile}
#-- do it
gnuplot << EOF
#set term x11
set term png font "arialbd.ttf" 18 size 950,600
set output "${ofile}"
set title "${base}"
set key noautotitles
unset mouse
set bmargin 4
set grid xtics ytics
set xlabel "Forward Voltage - mV"
set format x "%6.3f"
set xrange [1.8:2.1]
#set xtics 0,5
set mxtics 2
#set logscale y
#set ytics nomirror autofreq
set ylabel "Current - mA"
set format y "%4.0f"
#set yrange [0:${rds_max}]
#set mytics 2
#set y2label "right side variable"
#set y2tics nomirror autofreq 2
#set format y2 "%3.0f"
#set y2range [0:200]
#set y2tics 32
#set rmargin 9
set datafile separator "\t"
#set label 1 "Comment" at 0.90,0.35 font "arialbd,18"
plot	\
    "$1" using (\$5/1000):((\$1>0)?\$2/1000:NaN) with linespoints lt 3 lw 2 lc 1
EOF
-
Subscribe
Subscribed
Have a WordPress.com account? Log in now.

