-
Monthly Science: Patio Ground Temperature
The patio at the rear of our house is a six inch concrete slab with a five foot “crawlspace” below it, with a HOBO datalogger pendant in the dirt near the pole at the middle of the I beam supporting the slab. The pendant is very close to the surface, so there’s a big diurnal temperature variation, but it still gives a reasonable picture of seasonal change.
A configuration setting in Hoboware determines whether it stores / exports dates with years having two digits or four digits. As you might expect, over the course of five years the dates have both formats, but there’s always a blank separating the date and the time:
grep "/12 " /tmp/data.csv | head -1
1,11/09/12 08:45:00 ,49.050,,,,
grep "/2012 " /tmp/data.csv | head -1
2235,01/01/2012 00:00:00,44.560,0.0,,,,
This burst of sed regex line noise normalizes all years to four digits:
sed 's/\/\([0-9][0-9]\) /\/20\1 /' whatever.csv
The parenthesized subexpression matches the digits of a two digit year preceding a blank, then the
\1plugs it into the right spot in the output. This suffers from the usual failure when the century rolls over, but frankly, my dear readers, I don’t give a damn. The backslashes escape forward slashes and parentheses, in addition to making the regex pretty much write-only.The plot shows the expected annual variation:
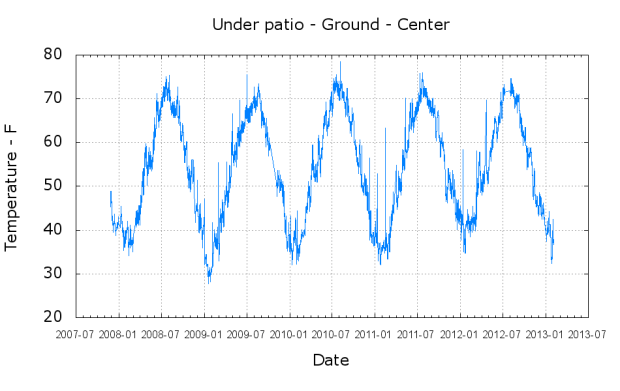
Under patio – Ground – Center The periodic upward spikes happen when I carry the logger to the Token Windows Laptop and read it out; the air temperature upstairs is always warmer than the dirt under the patio.
The Bash and gnuplot script that produced the graph:
#!/bin/sh
#-- overhead
export GDFONTPATH="/usr/share/fonts/truetype/"
base="${1%.*}"
echo Base name: ${base}
ofile=${base}.png
tfile=$(tempfile)
echo Input file: $1
echo Temporary file: ${tfile}
echo Output file: ${ofile}
#-- prepare csv Hobo logger file
sed 's/^\"/#&/' "$1" | sed 's/^.*Logged/#&/' | sed 's/ ,/,/' | sed 's/\/\([0-9][0-9]\) /\/20\1 /' > ${tfile}
#-- do it
gnuplot << EOF
#set term x11
set term png font "arialbd.ttf" 18 size 950,600
set output "${ofile}"
set title "${base}"
set key noautotitles
unset mouse
set bmargin 4
set grid xtics ytics
set timefmt "%m/%d/%Y %H:%M:%S"
set xdata time
set xlabel "Date"
set format x "%Y-%m"
#set xrange [1.8:2.2]
set xtics font "arial,12"
#set mxtics 2
#set logscale y
#set ytics nomirror autofreq
set ylabel "Temperature - F"
#set format y "%4.0f"
#set yrange [30:90]
#set mytics 2
#set y2label "right side variable"
#set y2tics nomirror autofreq 2
#set format y2 "%3.0f"
#set y2range [0:200]
#set y2tics 32
#set rmargin 9
set datafile separator ","
#set label 1 "label text" at 2.100,110 right font "arialbd,18"
#set arrow from 2.100,110 to 2.105,103 lt 1 lw 2 lc 0
plot	\
    "${tfile}" using 2:3 with lines lt 3
EOF
-
Subscribe
Subscribed
Have a WordPress.com account? Log in now.

