-
Kenmore 158: Current Sensor Calibration
The first task: produce an equation that converts raw ADC values into actual motor current. This is not quite the same as the DC calibration, because the motor current is neither clean nor stable.
Step the output current setpoint in 50 mA increments from 450 mA to 1100 mA and remain at each setpoint for 10 seconds while dumping measurements every 500 ms. The ADC count comes from the sampling / sorting / selection process that attempts to pick out either the not really flat top of the current-limited waveform or the peak of the non-limited sine wave.
Convert the raw data dump into a spreadsheet to get a block like this for each current setpoint:
Motor RPM Shaft RPM Setpoint mA DAC count ADC count Noisy mA Comp mA Setpoint: 600 DACvalue: 2372 3797 334 600 2372 266 724 540 4465 399 600 2372 263 715 532 4734 416 600 2372 265 721 538 4834 438 600 2372 263 715 532 4829 433 600 2372 264 718 535 4857 438 600 2372 264 718 535 4900 438 600 2372 265 721 538 4859 436 600 2372 266 724 540 4887 445 600 2372 265 721 538 4926 446 600 2372 263 715 532 4884 438 600 2372 265 721 538 4890 442 600 2372 264 718 535 4913 440 600 2372 264 718 535 4866 436 600 2372 263 715 532 4895 434 600 2372 264 718 535 4890 442 600 2372 266 724 540 4884 438 600 2372 266 724 540 4913 442 600 2372 265 721 538 4913 441 600 2372 266 724 540 4878 436 600 2372 264 718 535 265 The lone number on the bottom row is the computed average of the ADC counts for the block, which I did in the spreadsheet rather than in the firmware.
During each ten second interval, set the scope voltage cursor to the eyeballed “correct” value of the motor current waveform, as measured on the Tek current probe. There’s no way to automate this, because only the human eyeball can pick out the, ah, true current measurement amid all the clutter:
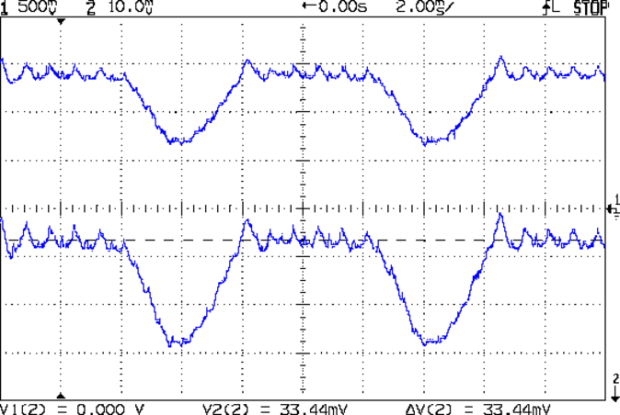
Calibrate – Hall amp – Tek 200 mA-div For each current setpoint value, create a line with the manually measured true voltage from the scope trace, the calculated true current (using the Tek probe’s front panel scale), along with the DAC setpoint and the average ADC values extracted from each block of that giant data dump:
Setpoint mA Scope mV Actual mA DAC count ADC count 450 21.80 436 2205 197 500 25.94 519 2261 225 550 29.06 581 2316 245 600 31.56 631 2372 265 650 34.38 688 2427 285 700 36.88 738 2483 304 750 39.69 794 2538 324 800 42.19 844 2594 340 850 45.00 900 2649 350 900 47.50 950 2705 361 850 46.86 937 2649 356 800 43.75 875 2594 348 750 41.25 825 2538 335 700 39.06 781 2483 318 650 36.56 731 2427 302 600 34.38 688 2372 285 550 32.50 650 2316 270 500 30.31 606 2261 253 450 27.81 556 2205 237 400 25.63 513 2150 220 Plot each actual motor current against the corresponding average ADC value:
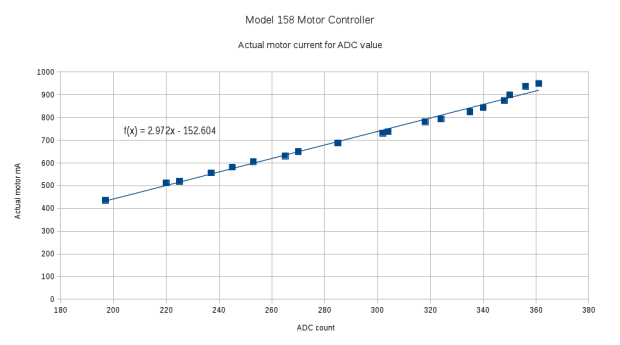
ADC Calibration Curve The linear fit breaks down toward 1 A, because measuring the actual peak of a noisy sine wave doesn’t work well, but the values aren’t all that far off.
Given an ADC value, that equation converts it directly into the actual motor current as estimated by the human eyeball, taking into account all the measurement weirdness. The Hall sensor produces a voltage that’s linearly related to the current, so the reasonable linearity of the data says that the sampling / sorting / selection process actually produces pretty nearly the correct result across the entire operating current range.
Note that the equation doesn’t depend on the DAC output calibration; the ADC and Tek probe simply measure whatever current happens to pass through the motor for that DAC value. The current through the ET227 transistor doesn’t seem to change over the ten seconds required to take the manual measurement, so it’s all good.


-
Subscribe
Subscribed
Have a WordPress.com account? Log in now.

