-
HP 7475A Plotter: SuperFormula With Paper Size Sensing
Well, it’s actually not “sensing”, but the demo code now sizes the graph to the paper size reported by the plotter, so you can plot on cheap and readily available A-size paper. The Vulcan Nerve Pinch that switches paper size on the fly is
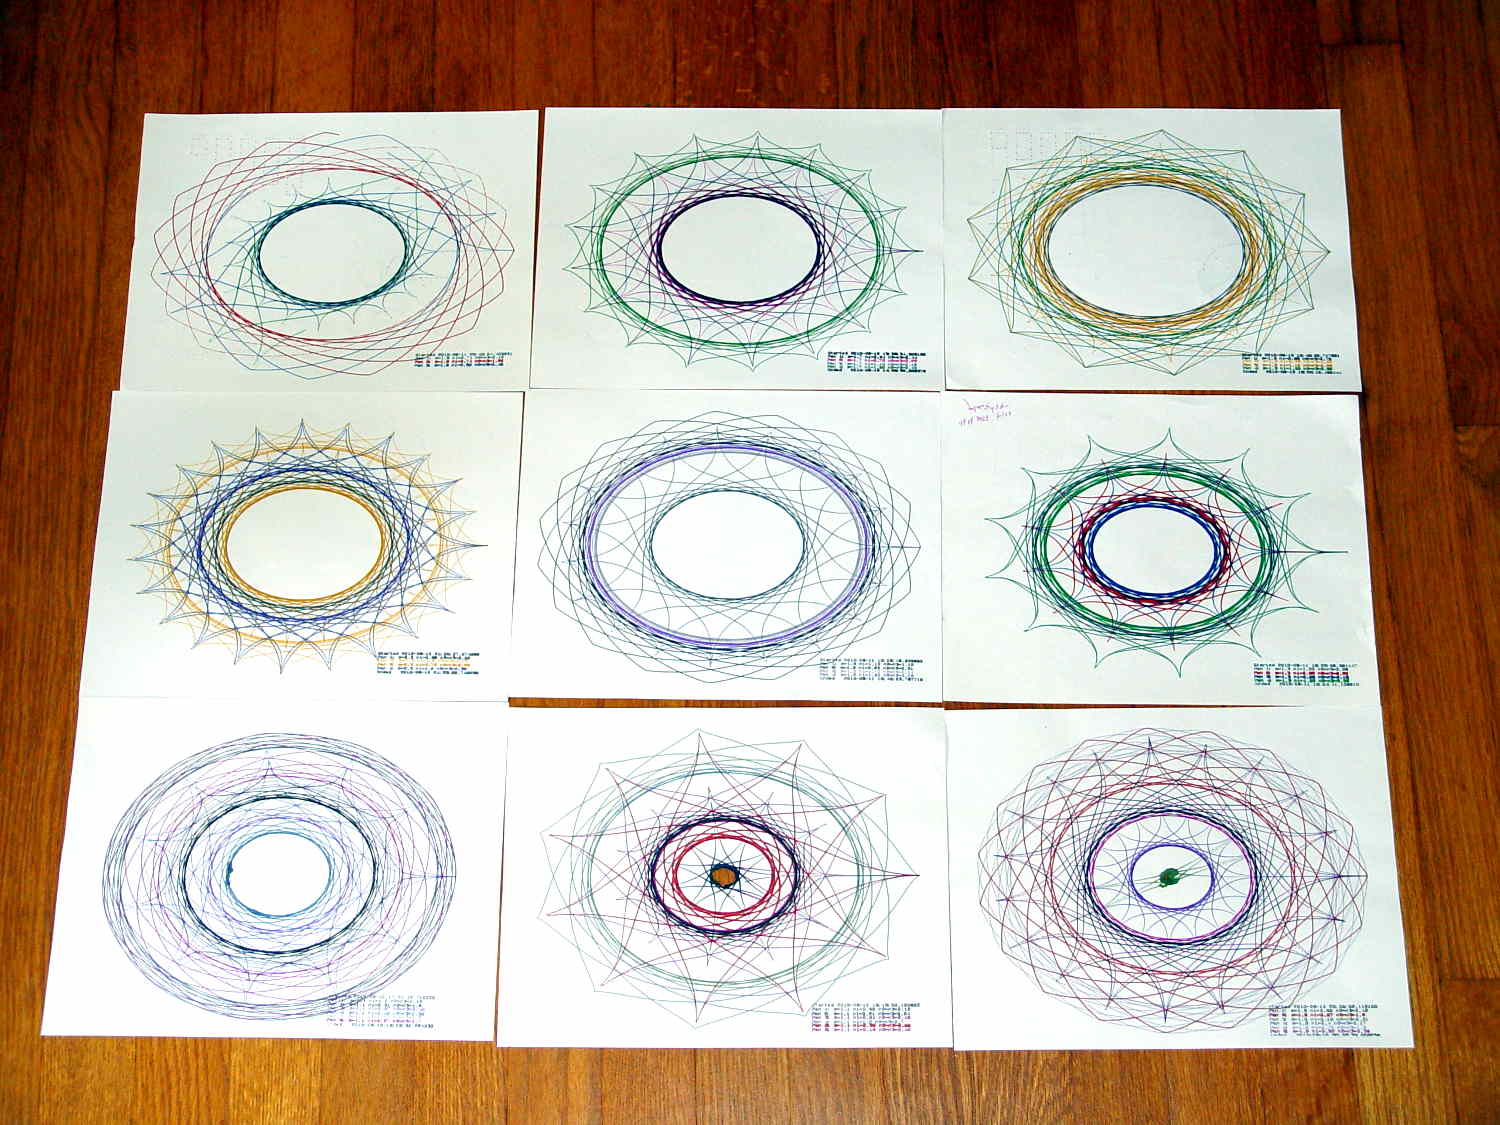
Enter+Size; I leave the DIP switches set for B-size sheets, because they’re more impressive and take longer to plot.A collection of A-size plots:

Superformula Plots – A-size paper The perspective foreshortening makes the sheets look square and the plots seem circular; they’re not.
The plots lie in rough time sequence from lower left to upper right, showing that I tweaked the
n1parameter to avoid the sort of tiny middle that gnawed a hole right through the center-bottom sheet. I also removed highermparameter values, because more than 50-ish points doesn’t work well on smaller sheets.I figured out how to use the Python ternary “operator” and tweaked the print formatting, but basically it’s a hack job through & through.
The Python source code, including the hacked Chiplotle routines that produce the SuperFormula:
from chiplotle import *
from math import *
from datetime import *
import random

def superformula_polar(a, b, m, n1, n2, n3, phi):
   ''' Computes the position of the point on a
   superformula curve.
   Superformula has first been proposed by Johan Gielis
   and is a generalization of superellipse.
   see: http://en.wikipedia.org/wiki/Superformula
   Tweaked to return polar coordinates
   '''

   t1 = cos(m * phi / 4.0) / a
   t1 = abs(t1)
   t1 = pow(t1, n2)

   t2 = sin(m * phi / 4.0) / b
   t2 = abs(t2)
   t2 = pow(t2, n3)

   t3 = -1 / float(n1)
   r = pow(t1 + t2, t3)
   if abs(r) == 0:
      return (0,0)
   else:
 #     return (r * cos(phi), r * sin(phi))
     return (r,phi)


def supershape(width, height, m, n1, n2, n3,
   point_count=10*1000, percentage=1.0, a=1.0, b=1.0, travel=None):
   '''Supershape, generated using the superformula first proposed
   by Johan Gielis.

   - `points_count` is the total number of points to compute.
   - `travel` is the length of the outline drawn in radians.
      3.1416 * 2 is a complete cycle.
   '''
   travel = travel or (10*2*pi)

   ## compute points...
   phis = [i * travel / point_count
      for i in range(1 + int(point_count * percentage))]
   points = [superformula_polar(a, b, m, n1, n2, n3, x) for x in phis]

   ## scale and transpose...
   path = [ ]
   for r, a in points:
      x = width * r * cos(a)
      y = height * r * sin(a)
      path.append(Coordinate(x, y))

   return Path(path)


## RUN DEMO CODE

if __name__ == '__main__':

   plt=instantiate_plotters()[0]
#   plt.write('IN;')

   if plt.margins.soft.width < 11000:               # A=10365 B=16640
       maxplotx = (plt.margins.soft.width / 2) - 100
       maxploty = (plt.margins.soft.height / 2) - 150
       legendx = maxplotx - 2600
       legendy = -(maxploty - 650)
       tscale = 0.45
       numpens = 4
       m_list = [n/10.0 for n in [11, 13, 17, 19, 23]];   # prime/10 = number of spikes
       n1_list = [n/100.0 for n in range(55,75,1) + range(80,120,5) + range(120,200,10)]  # ring-ness 0.1 to 2.0, higher is larger
   else:
       maxplotx = plt.margins.soft.width / 2
       maxploty = plt.margins.soft.height / 2
       legendx = maxplotx - 3000
       legendy = -(maxploty - 700)
       tscale = 0.45
       numpens = 6
       m_list = [n/10.0 for n in [11, 13, 17, 19, 23, 29, 31, 37, 41, 43, 47, 53, 59]];   # prime/10 = number of spikes
       n1_list = [n/100.0 for n in range(15,75,1) + range(80,120,5) + range(120,200,10)]  # ring-ness 0.1 to 2.0, higher is larger

   print "Max: ({},{})".format(maxplotx,maxploty)

   n2_list = [n/100.0 for n in range(10,50,1) + range(55,100,5) + range(110,200,10)]  # spike-ness 0.1 to 2.0, lower is spiky

   plt.write(chr(27) + '.H200:')   # set hardware handshake block size
   plt.set_origin_center()
   plt.write(hpgl.SI(tscale*0.285,tscale*0.375))    # scale based on B size characters
   plt.write(hpgl.VS(10))                           # slow speed for those abrupt spikes

   plt.select_pen(1)                                # standard loadout has pen 1 = black
   plt.write(hpgl.PA([(legendx,legendy)]))
   plt.write(hpgl.LB("Started " + str(datetime.today())))
   m = random.choice(m_list)

   pen = 1
   for n1, n2 in zip(random.sample(n1_list,numpens),random.sample(n2_list,numpens)):
    n3 = n2
    print "{0} - m: {1:.1f}, n1: {2:.2f}, n2=n3: {3:.2f}".format(pen,m,n1,n2)
    plt.select_pen(pen)
    plt.write(hpgl.PA([(legendx, legendy - 100*pen)]))
    plt.write(hpgl.LB("Pen {0}: m={1:.1f} n1={2:.2f} n2=n3={3:.2f}".format(pen,m,n1,n2)))
    e = supershape(maxplotx, maxploty, m, n1, n2, n3)
    plt.write(e)
    pen = pen + 1 if (pen % numpens) else 1

   plt.select_pen(1)
   plt.write(hpgl.PA([(legendx, legendy - 100*(numpens + 1))]))
   plt.write(hpgl.LB("Ended   " + str(datetime.today())))
   plt.select_pen(0)
-
Subscribe
Subscribed
Have a WordPress.com account? Log in now.

