-
Poughkeepsie ACM Chapter Presentation: Plotting Like It’s 1989!
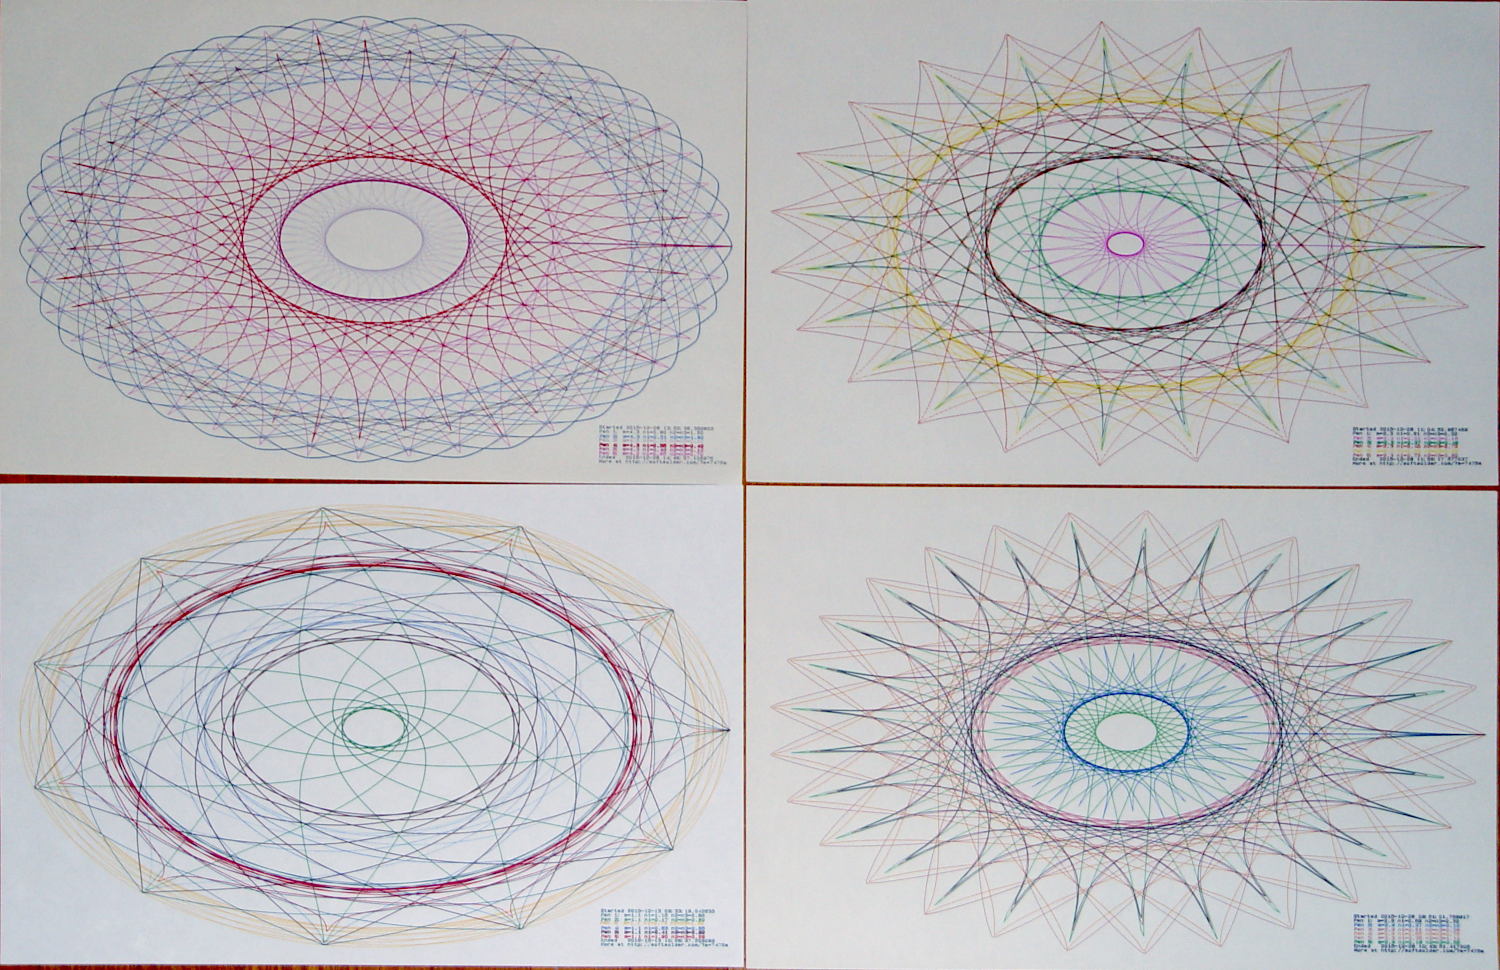
I’ll be giving an in-depth talk about my adventures restoring that old HP 7475A plotter for the Poughkeepsie ACM Chapter at Marist College this evening:

Superformula Plot – Composite D This being the Association for Computing Machinery, I will talk a bit about the Superformula that makes it all possible:
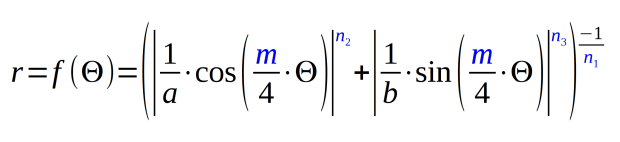
Gielis Superformula – parameters The presentation will look a lot like this: ACM – Plotting Like Its 1989. The PDF doesn’t include my patter, but perhaps the linky love on each screen can fill in the details.
If you’re following along, the Python source code running on the plotter as a GitHub Gist:
This file contains hidden or bidirectional Unicode text that may be interpreted or compiled differently than what appears below. To review, open the file in an editor that reveals hidden Unicode characters. Learn more about bidirectional Unicode charactersfrom chiplotle import * from math import * from datetime import * from time import * from types import * import random def superformula_polar(a, b, m, n1, n2, n3, phi): ''' Computes the position of the point on a superformula curve. Superformula has first been proposed by Johan Gielis and is a generalization of superellipse. see: http://en.wikipedia.org/wiki/Superformula Tweaked to return polar coordinates ''' t1 = cos(m * phi / 4.0) / a t1 = abs(t1) t1 = pow(t1, n2) t2 = sin(m * phi / 4.0) / b t2 = abs(t2) t2 = pow(t2, n3) t3 = -1 / float(n1) r = pow(t1 + t2, t3) if abs(r) == 0: return (0, 0) else: # return (r * cos(phi), r * sin(phi)) return (r, phi) def supershape(width, height, m, n1, n2, n3, point_count=10 * 1000, percentage=1.0, a=1.0, b=1.0, travel=None): '''Supershape, generated using the superformula first proposed by Johan Gielis. – `points_count` is the total number of points to compute. – `travel` is the length of the outline drawn in radians. 3.1416 * 2 is a complete cycle. ''' travel = travel or (10 * 2 * pi) # compute points… phis = [i * travel / point_count for i in range(1 + int(point_count * percentage))] points = [superformula_polar(a, b, m, n1, n2, n3, x) for x in phis] # scale and transpose… path = [] for r, a in points: x = width * r * cos(a) y = height * r * sin(a) path.append(Coordinate(x, y)) return Path(path) # RUN DEMO CODE if __name__ == '__main__': override = False plt = instantiate_plotters()[0] # plt.write('IN;') if plt.margins.soft.width < 11000: # A=10365 B=16640 maxplotx = (plt.margins.soft.width / 2) – 100 maxploty = (plt.margins.soft.height / 2) – 150 legendx = maxplotx – 2900 legendy = -(maxploty – 750) tscale = 0.45 numpens = 4 # prime/10 = number of spikes m_values = [n / 10.0 for n in [11, 13, 17, 19, 23]] # ring-ness 0.1 to 2.0, higher is larger n1_values = [ n / 100.0 for n in range(55, 75, 2) + range(80, 120, 5) + range(120, 200, 10)] else: maxplotx = plt.margins.soft.width / 2 maxploty = plt.margins.soft.height / 2 legendx = maxplotx – 3000 legendy = -(maxploty – 900) tscale = 0.45 numpens = 6 m_values = [n / 10.0 for n in [11, 13, 17, 19, 23, 29, 31, 37, 41, 43, 47, 53, 59]] # prime/10 = number of spikes # ring-ness 0.1 to 2.0, higher is larger n1_values = [ n / 100.0 for n in range(15, 75, 2) + range(80, 120, 5) + range(120, 200, 10)] print " Max: ({},{})".format(maxplotx, maxploty) # spiky-ness 0.1 to 2.0, higher is spiky-er (mostly) n2_values = [ n / 100.0 for n in range(10, 60, 2) + range(65, 100, 5) + range(110, 200, 10)] plt.write(chr(27) + '.H200:') # set hardware handshake block size plt.set_origin_center() # scale based on B size characters plt.write(hpgl.SI(tscale * 0.285, tscale * 0.375)) # slow speed for those abrupt spikes plt.write(hpgl.VS(10)) while True: # standard loadout has pen 1 = fine black plt.write(hpgl.PA([(legendx, legendy)])) pen = 1 plt.select_pen(pen) plt.write(hpgl.PA([(legendx, legendy)])) plt.write(hpgl.LB("Started " + str(datetime.today()))) if override: m = 4.1 n1_list = [1.15, 0.90, 0.25, 0.59, 0.51, 0.23] n2_list = [0.70, 0.58, 0.32, 0.28, 0.56, 0.26] else: m = random.choice(m_values) n1_list = random.sample(n1_values, numpens) n2_list = random.sample(n2_values, numpens) pen = 1 for n1, n2 in zip(n1_list, n2_list): n3 = n2 print "{0} – m: {1:.1f}, n1: {2:.2f}, n2=n3: {3:.2f}".format(pen, m, n1, n2) plt.select_pen(pen) plt.write(hpgl.PA([(legendx, legendy – 100 * pen)])) plt.write( hpgl.LB("Pen {0}: m={1:.1f} n1={2:.2f} n2=n3={3:.2f}".format(pen, m, n1, n2))) e = supershape(maxplotx, maxploty, m, n1, n2, n3) plt.write(e) pen = pen + 1 if (pen % numpens) else 1 pen = 1 plt.select_pen(pen) plt.write(hpgl.PA([(legendx, legendy – 100 * (numpens + 1))])) plt.write(hpgl.LB("Ended " + str(datetime.today()))) plt.write(hpgl.PA([(legendx, legendy – 100 * (numpens + 2))])) plt.write(hpgl.LB("More at https://softsolder.com/?s=7475a")) plt.select_pen(0) plt.write(hpgl.PA([(-maxplotx,maxploty)])) print "Waiting for plotter… ignore timeout errors!" sleep(40) while NoneType is type(plt.status): sleep(5) print "Load more paper, then …" print " … Press ENTER on the plotter to continue" plt.clear_digitizer() plt.digitize_point() plotstatus = plt.status while (NoneType is type(plotstatus)) or (0 == int(plotstatus) & 0x04): plotstatus = plt.status print "Digitized: " + str(plt.digitized_point)

-
Subscribe
Subscribed
Have a WordPress.com account? Log in now.

